13 releases
| 0.2.1 | Oct 6, 2024 |
|---|---|
| 0.2.0 | Oct 4, 2024 |
| 0.1.12 | Oct 2, 2024 |
| 0.1.10 | Sep 30, 2024 |
#57 in Visualization
26 downloads per month
105KB
2K
SLoC
ttydash
![]()
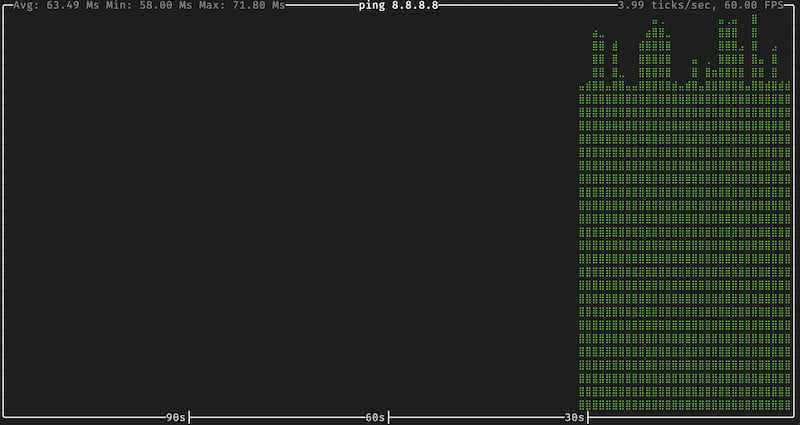
Snapshot
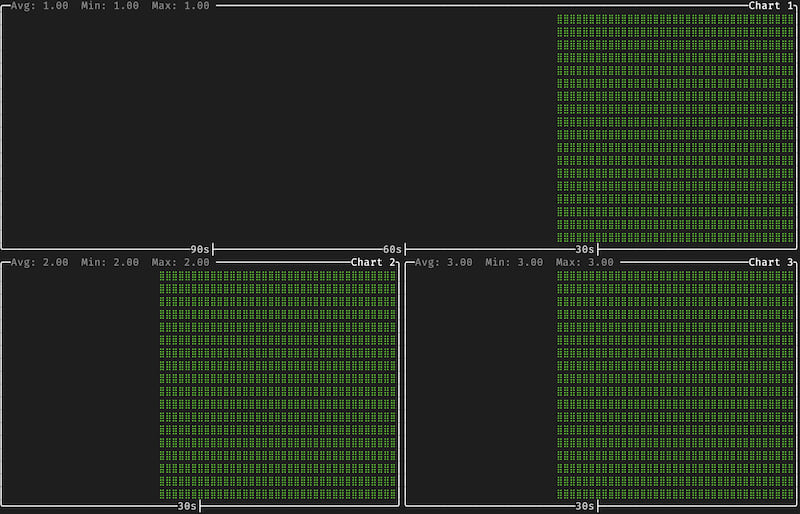
Auto Layout
Installation
cargo install ttydash
ttydash Usage Guide
Single Line Data Input
Pure Data Input (No Title, No Unit)
To input pure data continuously, use the following command:
while true; echo 1; sleep 0.5; end | ttydash
Adding a Title (Optional)
If you want to add a title to the data chart, just use the -t flag:
while true; echo 1; sleep 0.5; end | ttydash -t "🌟 Title"
Adding Units (Optional)
If each line of data comes with a unit (e.g., "ms"), you can specify the unit with the -u flag.
Example 1️:
while true; echo 1ms; sleep 0.5; end | ttydash -u ms
Example 2️:
while true; echo 1 ms; sleep 0.5; end | ttydash -u ms
👉 Note: The space between the number and the unit is optional.
➕ Multiple Data Points on the Same Line
To input multiple data points at once, just separate them with a space. For example:
while true; echo "1 2 3"; sleep 0.5; end | ttydash
📊 ttydash will plot the data points in the order they are provided!
🎯 Plot Specific Data Points Using the -i Flag
If you only want to plot specific data points, you can use the -i flag to select their index. For example:
while true; echo "1 2 3"; sleep 0.5; end | ttydash -i 1 -i 2
In this example, only the data at index 1 and index 2 will be plotted.
👉 Note: You can switch the sequence of the index as needed. For example:
ttydash -i 2 -i 1
This will plot index 2 first, followed by index 1.
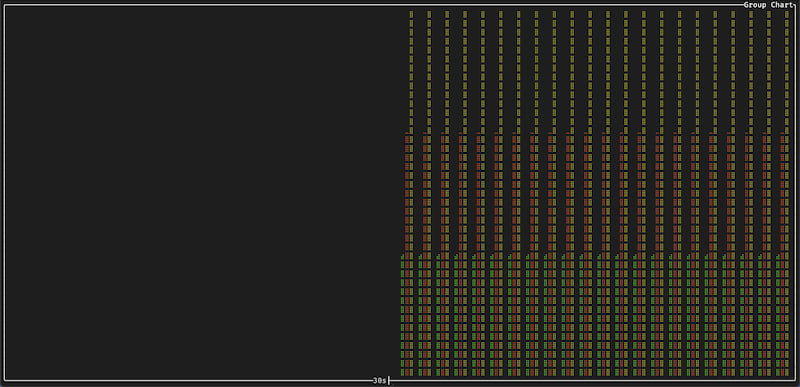
📈 Group Chart
while true; echo "1 2 3"; sleep 0.5; end | ttydash -g
flags
A terminal-based dashboard for real-time data visualization.

Usage: ttydash [OPTIONS] [COMMAND]

Commands:
  add     Add a new regex to the list of regexes
  remove  Remove a regex from the list of regexes
  list    List all regexes
  help    Print this message or the help of the given subcommand(s)

Options:
      --tick-rate <FLOAT>       Tick rate, i.e. number of ticks per second [default: 4]
  -f, --frame-rate <FLOAT>      Frame rate, i.e. number of frames per second [default: 60]
  -t, --titles <STRING>         Chart title, will be shown at the top of the chart
  -u, --units <UNITS>           Unit to be used in the chart (e.g. "ms", "MB")
  -i, --indices <INT>           Index vector to be used in the chart
  -g, --group[=<GROUP>]         Group together to show multiple charts in the same window [default: false] [possible values: true, false]
      --update-frequency <INT>  Update frequency, i.e. number of milliseconds between updates [default: 1000]
  -l, --layout <STRING>         Layout of the chart [default: auto] [possible values: horizontal, vertical, auto]
  -h, --help                    Print help
  -V, --version                 Print version
Dependencies
~24–39MB
~620K SLoC