77 releases
| 0.3.22 | Apr 26, 2025 |
|---|---|
| 0.3.20 | Mar 1, 2025 |
| 0.3.19 | Oct 26, 2024 |
| 0.3.13 | Jul 13, 2024 |
| 0.1.17 | Jul 29, 2023 |
#60 in Images
991 downloads per month
405KB
11K
SLoC
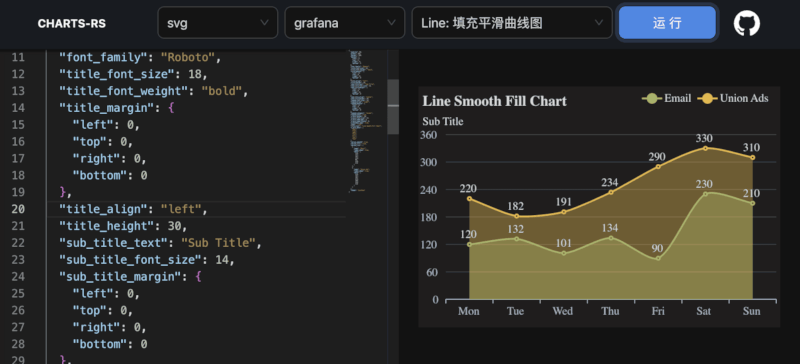
charts-rs
charts-rs is a charting library for rust. It's simple and fast.
![]()
![]()
![]()
Overview
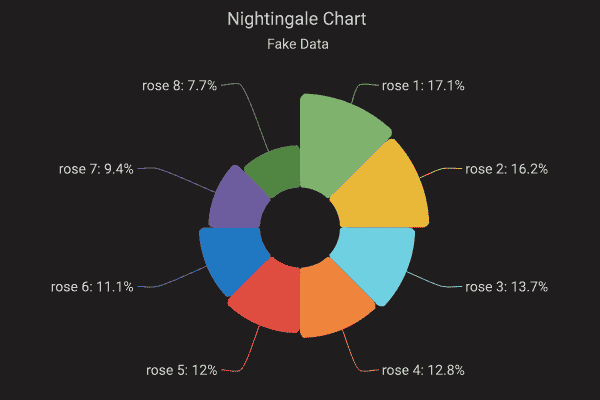
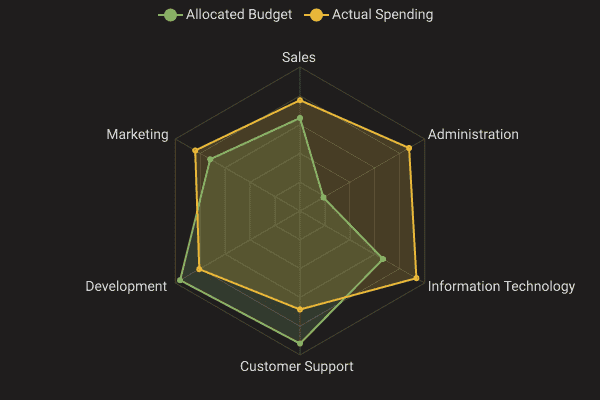
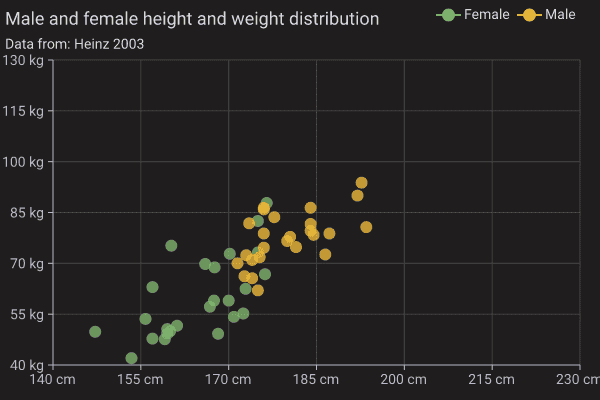
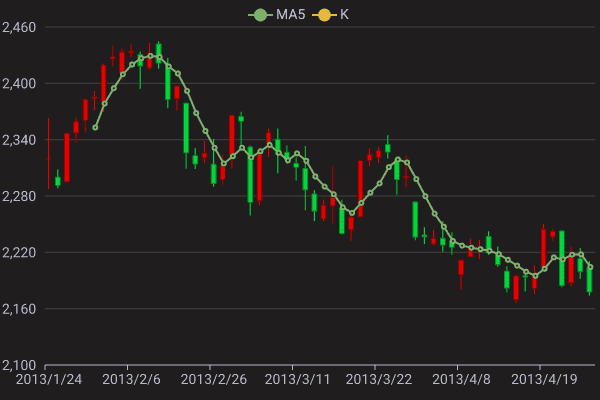
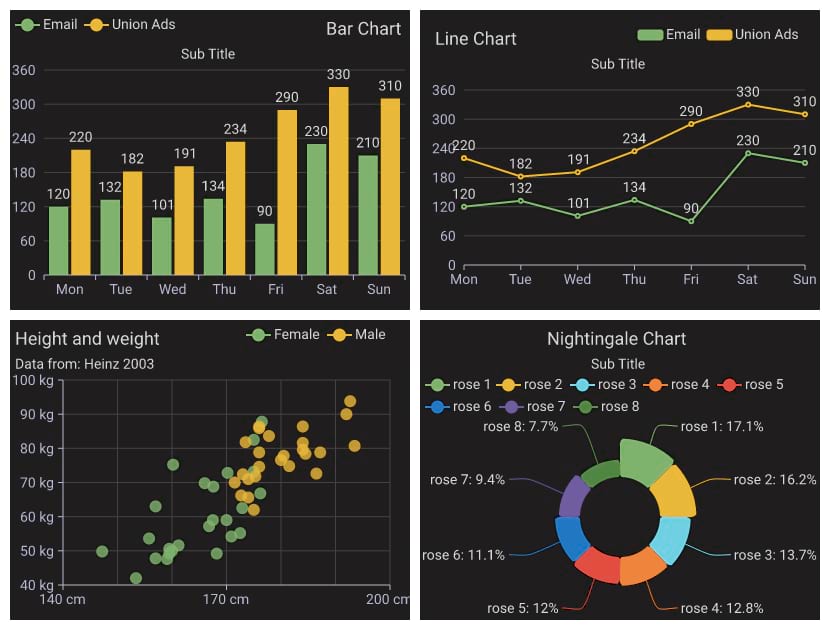
charts-rs is simpler way for generating charts, which supports svg and png format and themes: light, dark, grafana, ant, vintage, walden, westeros, chalk and shine. The default theme is light. These charts are supported: Bar, HorizontalBar, Line, Pie, Radar, Scatter, Candlestick, Table, Heatmap and MultiChart.
Apache ECharts is popular among Front-end developers, and charts-rs reference it. Developers can generate charts almost the same as Apache ECharts.
Themes
Feature
- Multiple themes for all charts
- Load font family from ttf or otf
- Smooth, fill, mark point and mark line for line chart
- Multiple legends for all charts, for example:
round rect,circleandrect - Supports two y axises, which are useful
- New from json is simple and easy
- Svg, png, jpeg, webp and avif format support more available scenarios
- Web json editor to try using more options by one step
Demo
You can try to use the web demo page, it's simple and useful.
Charts Web Demo Page: https://charts.npmtrend.com/
Charts Web Source: https://github.com/vicanso/charts-rs-web
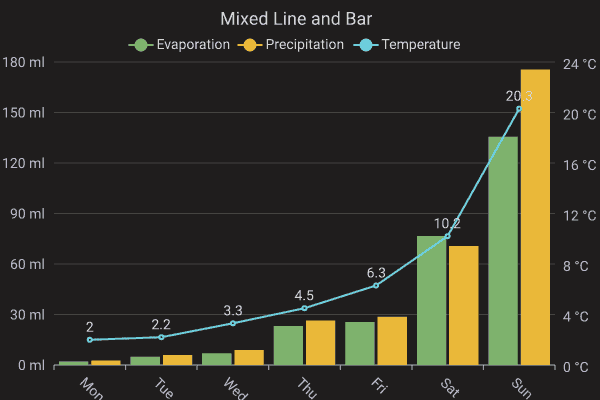
Mix line bar
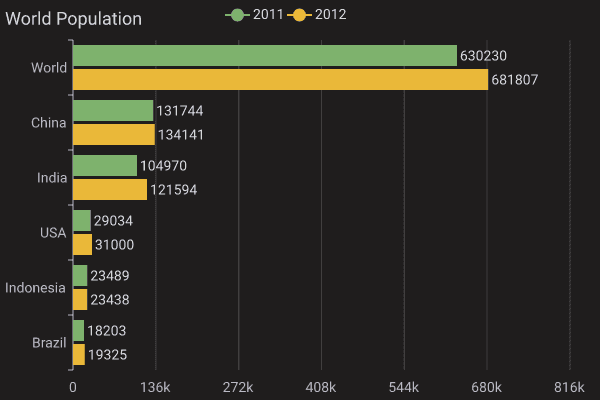
Horizontal bar
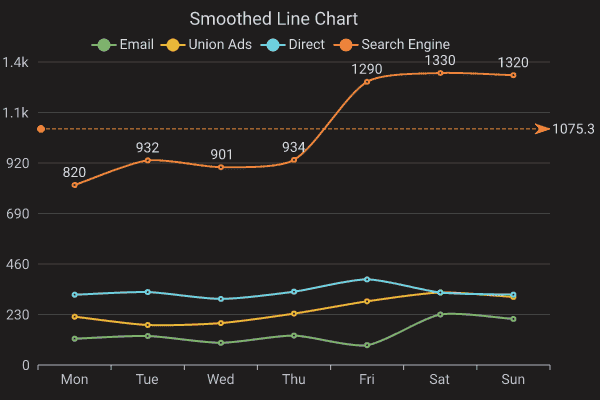
Line
Pie
Radar
Scatter
Candlestick
Table

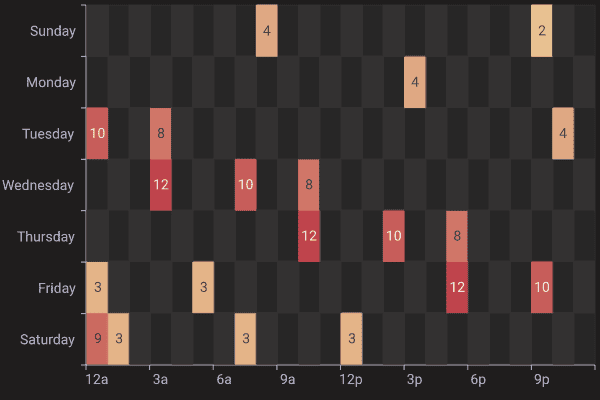
Heatmap
Multi Chart
Example
New from option
use charts_rs::{
    BarChart, Box, SeriesCategory, THEME_GRAFANA
};
let mut bar_chart = BarChart::new_with_theme(
    vec![
        ("Evaporation", vec![2.0, 4.9, 7.0, 23.2, 25.6, 76.7, 135.6]).into(),
        (
            "Precipitation",
            vec![2.6, 5.9, 9.0, 26.4, 28.7, 70.7, 175.6],
        )
            .into(),
        ("Temperature", vec![2.0, 2.2, 3.3, 4.5, 6.3, 10.2, 20.3]).into(),
    ],
    vec![
        "Mon".to_string(),
        "Tue".to_string(),
        "Wed".to_string(),
        "Thu".to_string(),
        "Fri".to_string(),
        "Sat".to_string(),
        "Sun".to_string(),
    ],
    THEME_GRAFANA,
);
bar_chart.title_text = "Mixed Line and Bar".to_string();
bar_chart.legend_margin = Some(Box {
    top: bar_chart.title_height,
    bottom: 5.0,
    ..Default::default()
});
bar_chart.series_list[2].category = Some(SeriesCategory::Line);
bar_chart.series_list[2].y_axis_index = 1;
bar_chart.series_list[2].label_show = true;

bar_chart
    .y_axis_configs
    .push(bar_chart.y_axis_configs[0].clone());
bar_chart.y_axis_configs[0].axis_formatter = Some("{c} ml".to_string());
bar_chart.y_axis_configs[1].axis_formatter = Some("{c} °C".to_string());

println!("{}", &bar_chart.svg().unwrap());
svg_to_png(&bar_chart.svg().unwrap()).unwrap();
From json
use charts_rs::{BarChart, svg_to_png};
let bar_chart = BarChart::from_json(
    r###"{
        "width": 630,
        "height": 410,
        "margin": {
            "left": 10,
            "top": 5,
            "right": 10
        },
        "title_text": "Bar Chart",
        "title_font_color": "#345",
        "title_align": "right",
        "sub_title_text": "demo",
        "legend_align": "left",
        "series_list": [
            {
                "name": "Email",
                "label_show": true,
                "data": [120.0, 132.0, 101.0, 134.0, 90.0, 230.0, 210.0]
            },
            {
                "name": "Union Ads",
                "data": [220.0, 182.0, 191.0, 234.0, 290.0, 330.0, 310.0]
            }
        ],
        "x_axis_data": [
            "Mon",
            "Tue",
            "Wed",
            "Thu",
            "Fri",
            "Sat",
            "Sun"
        ]
    }"###,
).unwrap();
println!("{}", bar_chart.svg().unwrap());
svg_to_png(&bar_chart.svg().unwrap()).unwrap();
Load more fonts
let buf = fs::read(file).unwrap();
get_or_try_init_fonts(vec![&buf]));
License
This project is licensed under the MPL-2.0 license.
Dependencies
~5–12MB
~227K SLoC