13 releases (breaking)
| 0.11.0 | Sep 18, 2024 |
|---|---|
| 0.10.0 | Feb 17, 2024 |
| 0.9.0 | Jul 29, 2023 |
| 0.7.0 | Feb 21, 2023 |
| 0.1.2 |
|
#25 in Visualization
2,395 downloads per month
Used in 7 crates
200KB
893 lines
plotters-iced
![]()
![]()
![]()
![]()
This is an implementation of an Iced backend for Plotters, for both native and wasm applications.
This backend has been optimized as for speed. Note that some specific plotting features supported in the Bitmap backend may not be implemented there, though.
Showcase
What is Plotters?
Plotters is an extensible Rust drawing library that can be used to plot data on nice-looking graphs, rendering them through a plotting backend (eg. to a Bitmap image raw buffer, to your GUI backend, to an SVG file, etc.).
For more details on Plotters, please check the following links:
- For an introduction of Plotters, see: Plotters on Crates.io;
- Check the main repository on GitHub;
- You can also visit the Plotters homepage;
How to install?
Include plotters-iced in your Cargo.toml dependencies:
[dependencies]
plotters-iced = "0.11"
iced = { version = "0.13", features = ["canvas", "tokio"] }
plotters="0.3"
How to use?
First, import Chart and ChartWidget:
use plotters_iced::{Chart, ChartWidget, DrawingBackend, ChartBuilder};
Then, derive Chart trait and build your chart, and let plotters-iced takes care the rest:
struct MyChart;
impl Chart<Message> for MyChart {
    type State = ();
    fn build_chart<DB:DrawingBackend>(&self, state: &Self::State, builder: ChartBuilder<DB>) {
        //build your chart here, please refer to plotters for more details
    }
}
Finally, render your chart view:
impl MyChart {
    fn view(&mut self)->Element<Message> {
        ChartWidget::new(self)
            .width(Length::Fixed(200))
            .height(Length::Fixed(200))
            .into()
    }
}
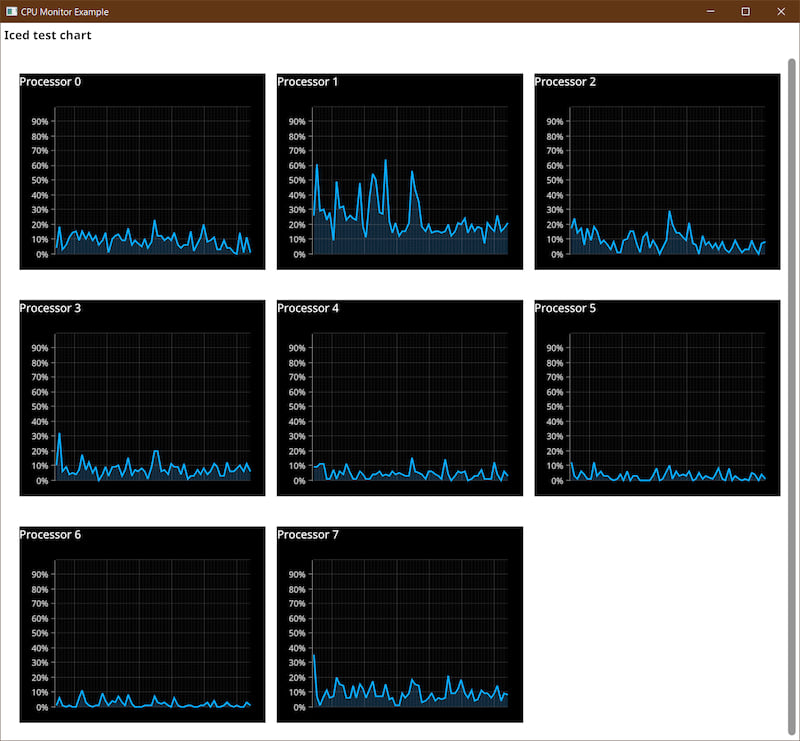
If you are looking for a full example of an implementation, please check cpu-monitor.rs.
How to run the examples?
Example #1: cpu-monitor
This example samples your CPU load every second, and renders it in a real-time chart:
cargo run --release --example cpu-monitor
From this example, you'll learn:
- how to build charts by
plotters-iced - how to feed data to charts
- how to make layouts of charts responsive
- how to use fonts with charts
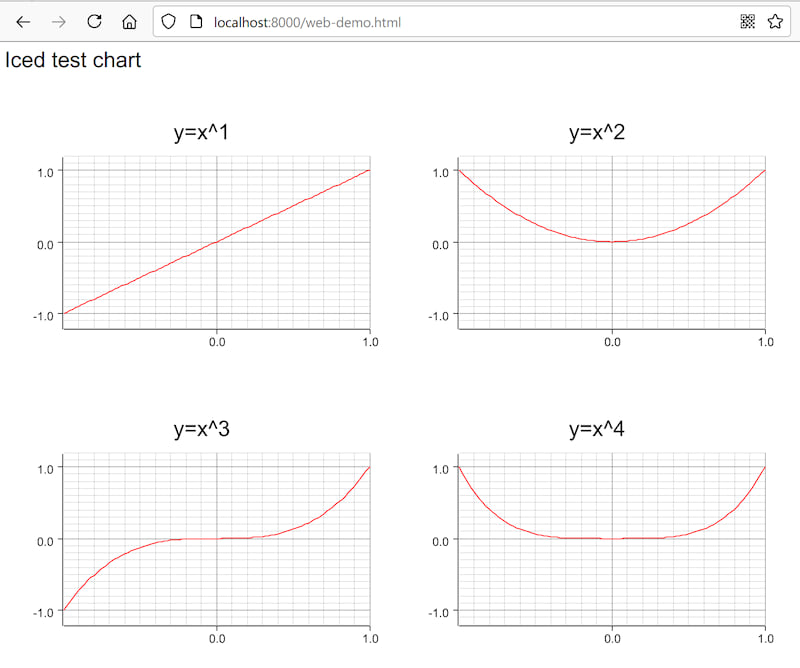
Example #2: split-chart
This example shows you how to split drawing area.
- run the native version
cargo run --release --example split-chart
- run the web version
cd examples/split-chart
trunk serve
Are there any limitations?
Limitation #1: No image rendering
No image rendering for native and wasm applications.
Limitation #2: Limited text rendering for native applications
Only TTF font family are supported for text rendering, which is a limitation of Iced, please look at cpu-monitor.rs. As well, font transforms are not supported,which is also a limitation of Iced.
Credits
Dependencies
~38–67MB
~1M SLoC