46 releases
| 0.0.46 | Apr 20, 2025 |
|---|---|
| 0.0.45 | Feb 9, 2025 |
| 0.0.44 | Oct 31, 2024 |
| 0.0.43 | Mar 23, 2024 |
| 0.0.0 | Dec 4, 2014 |
#99 in Visualization
13,321 downloads per month
Used in 53 crates
(48 directly)
285KB
7K
SLoC
RustGnuplot
A Gnuplot controller written in Rust.
![]()
![]()
Documentation
On docs.rs
Examples
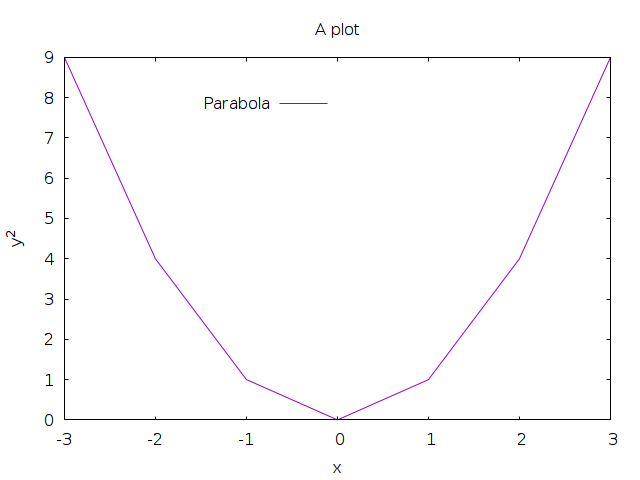
A simple example:
let mut fg = Figure::new();
fg.axes2d()
	.set_title("A plot", &[])
	.set_legend(Graph(0.5), Graph(0.9), &[], &[])
	.set_x_label("x", &[])
	.set_y_label("y^2", &[])
	.lines(
		&[-3., -2., -1., 0., 1., 2., 3.],
		&[9., 4., 1., 0., 1., 4., 9.],
		&[Caption("Parabola")],
	);
fg.show().unwrap();
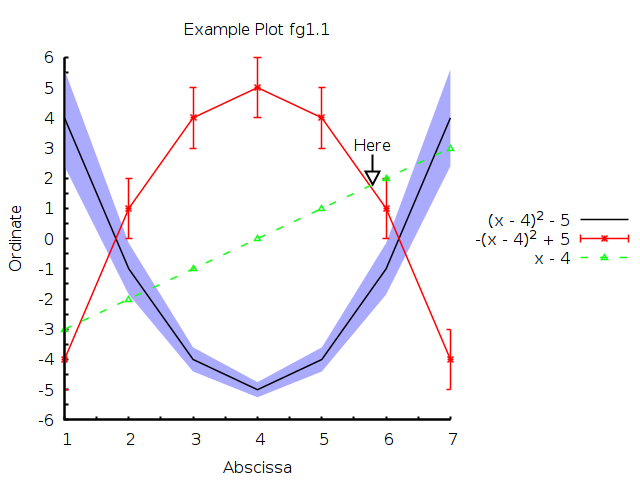
A somewhat involved 2D example (see example1.rs in the examples directory):
Features
- Simple 2D plots
- lines
- points
- points + lines
- error bars
- ...and more!
- Simple 3D plots
- surface plots
- heatmaps
- contours
Building
Via Cargo
cargo build
lib.rs:
A simple gnuplot controller.
Example
use gnuplot::{Figure, Caption, Color};

let x = [0u32, 1, 2];
let y = [3u32, 4, 5];
let mut fg = Figure::new();
fg.axes2d()
.lines(&x, &y, &[Caption("A line"), Color("black".into())]);
fg.show();
Dependencies
~2–11MB
~131K SLoC