13 releases (breaking)
Uses new Rust 2024
| new 0.11.0 | Apr 30, 2025 |
|---|---|
| 0.10.2 | Mar 18, 2025 |
| 0.10.1 | Aug 4, 2024 |
| 0.10.0 | May 7, 2024 |
| 0.2.0 | Nov 28, 2020 |
#19 in #csv
138 downloads per month
3MB
1.5K
SLoC
Tass
A pager for tabular data
tass - it's like less, but for tables! It can read CSV/TSV and parquet
files, and even ND-JSON in a pinch. It looks like this:
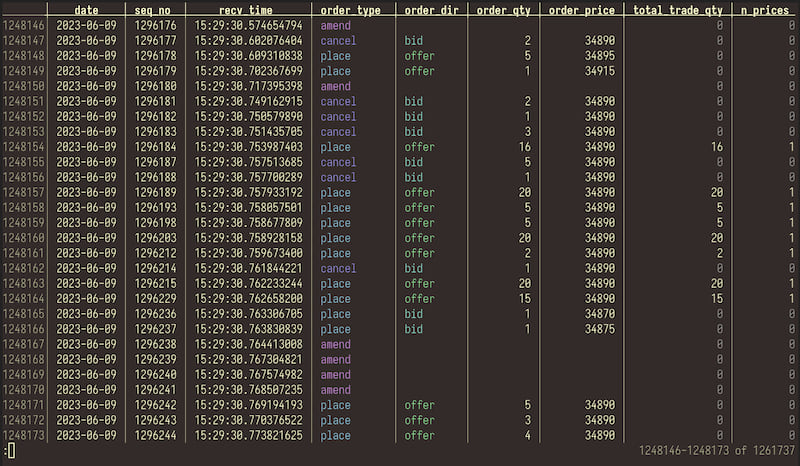
You can see tass's schema inference in action here. The fourth and fifth columns only contain a small number of unique values, so tass colour-codes them automatically. The columns to the right of those are numerical, so tass right-aligns them and shows negative values in red.

This demo shows data being piped into (an older version of) tass. You can also open files which are still being appeanded to, and new rows will appear as the file grows.
Installing
If you already have rust, you can install tass like this:
$ cargo install tass
Usage
You can pass a filename, or pipe data to stdin:
$ tass mydata.csv
$ cat mydata.csv | tass
| Key | Action |
|---|---|
| Up/j, PageUp | Move up one row, page |
| Down/k,PageDown | Move down one row, page |
| Left/h | Move left one column |
| Right/l | Move right one column |
| Home, End | Move to start/end of file |
| number g | Move to line $number |
| f | Move to end and auto-scroll as new rows come in |
| /, ? | Search, reverse-search for string |
| n, N | Jump to next, previous match |
| q/Esc | Quit |
Comparison to other tools
| Tool | Functionality | Convenience | Filetypes | Loads whole file into memory | Live view growing data |
|---|---|---|---|---|---|
| tass | ⭐ Viewing data, basic searching | 🚀 Snappy TUI | CSV/TSV, parquet, JSON | no 😌 | ✔️ |
| csvlens | ⭐ Similar to tass | 🚀 Similar to tass | CSV/TSV | no 😌 | ✔️ |
| VisiData | ⭐⭐ Summary stats, plots, etc. | TUI, a bit clunky | CSV/TSV, parquet, JSON, ... | yes 😱 | ✔️ |
| Excel/Calc/Numbers/Google Sheets | ⭐⭐ It's a spreadsheet! | ⏳ Launch a GUI app | CSV/TSV, xls, ods, ... | yes 😱 | ❌ |
| Pandas/Polars/DataFrame.jl | ⭐⭐⭐ It's a dataframe library! | ⏳ A bunch of typing | CSV/TSV, parquet, ... | it depends | ❌ |
| duckdb | ⭐⭐⭐ It's a database! | ⏳ A bunch of typing | CSV/TSV, parquet, ... | it depends | ❌ |
For manipulating data, my advice is to use a spreadsheet (for small datasets) or dataframe library (for larger datasets). Sometimes you just want to quickly inspect the contents of a file though, and that's what tass is for.
Tips & tricks
Here are some more tips for working with large CSV files:
- If you want to see summary statistics but don't care about the underlying data itself, you can still use VisiData/Excel/etc.: just downsample it first. This will reduce the precision of your stats and plots, but not the overall shape (probably). xsv has a subcommand that can do this for you.
- If you want exact answers to complex questions, use a dataframe library. Alternatively, consider dumping your CSV into a sqlite database and working with that instead.
- For ad-hoc computations on CSV files, take a look at frawk - it's really nice.
Dependencies
~36–54MB
~1M SLoC