1 unstable release
| 0.1.0 | Nov 30, 2020 |
|---|
#784 in Machine learning
114 downloads per month
Used in cbdr
4KB
56 lines
Continuous Benchmarking, Done Right
Run benchmarks as part of your continuous integration ⇒ automatically flag MRs which regress performance.
Sounds good, right? So why is it so uncommon to see benchmarks in CI? The problem is that it's hard to boil it down to a simple "pass/fail". CI runners are typically very noisy, so you need to be careful if you want reliable results.
It's hard, but if you care about performance then it's worth it. Without benchmarks in your CI, accidental regressions will happen. It's easier to fix them when they're fresh.
Here's the situation:
- there's some number you care about: CPU seconds, max memory usage, whatever;
- except it's not really a number - it's a distribution - and the number you actually care about is the mean of that distribution;
- and the thing you actually care about is not the mean per-se, but how much it'll change if you merge your branch.
In other words, there are two unknown distributions ("pre-merge" and "post-merge"), and our challenge is to estimate how much their means differ by sampling from them repeatedly. (This is known as the Behrens–Fisher problem, if you assume the distributions are Gaussian.)
This page contains some assorted advice on what not to do. You may be
interested in the method I actually use, which is described here.
If you're looking for cbdr, a tool which automates some of the advice
given here, look here instead.
❌ Benchmarking commit A, then benchmarking commit B
Most benchmarking software I see works like this:
- It takes a bunch of measurements of the first thing.
- It takes a bunch of measurements of the second thing.
- It compares the two samples.
Why is this bad? Imagine you finish benchmarking commit A on a quiet machine, but then a cron jobs starts just as you start benchmarking commit B; the penalty is absorbed entirely by commit B!
So what should I do instead? I suggest that you randomly intersperse runs from the two things you're comparing. Consider the example above: if you randomize the measurements then the penalty of the cron job will be evenly spread across both commits. It will hurt the precision of your results, but not the accuracy (which is more important).
And there's a bonus: you can keep sampling until you achieve your desired precision. After each sample, you look at how wide the confidence interval of the mean-difference is. If it's too wide you keep taking samples; if it's narrow enough, you stop.
(Suppose, on the other hand, you group your measurements as described at the start. You're benchmarking A and wondering if it's time to move on to B. You can compute a confidence interval for the mean of A, but that doesn't really tell you how tight the confidence interval for the difference of the means is going to be. Just because you have a precise estimate of the mean for commit A, it doesn't mean you're going to have enough data for a precise estimate of the mean-difference.)
❌ Saving old benchmark results for later use
This is just a more extreme version of "benchmarking commit A, then benchmarking commit B", except now your results are correlated with sources of noise which vary at the day- or month-scale. Is your cooling good enough to ensure that results taken in the summer are comparable with results taken in the winter? (Ours isn't.) Did you upgrade any hardware between now and then? Did you change anything in /etc?
In addition to improving the quality of your data, freshly benchmarking the base means your CI runs are now (1) stateless and (2) machine-independent. If you want to reuse old results, you need to maintain a database and a dedicated benchmarking machine. If you re-bench the base, you can use any available CI machine and all it needs is your code.
Re-benchmarking old commits feels like a waste of CPU-time; but your CI machines will spend - at most - 2x longer on benchmarking. Is that really a resource you need to claw back?
⚠️ Checking-in benchmark thresholds
Some projects keep benchmark thresholds checked in to their repo, and fail in CI when those thresholds are exceeded. If the slowdown is expected, you update the thresholds in the same PR. The idea is that it allows you to detect slow, long-term performance creep. It's a nice idea.
(Sidenote: I've already argued against storing old benchmark results generally, but we can fix that: instead of checking in results, we could check in a reference to some old version of the code to benchmark against.)
This scheme does indeed allow you to detect performance creep. The problem, though, is that when you do detect is, there's rarely anything you can do about it. The failing commit isn't really to blame - it's just the straw that broke the camel's back. So in practice you just update the threshold and move on. Once this becomes a habit, your benchmarks are useless.
The GHC people had a system like this in place for a long time but recently ditched it because it was just seen as a nuisance.
❌ Computing the two means and comparing them
This is not a great idea, even when confidence intervals are included. Quoting the Biostats handbook:
There is a myth that when two means have confidence intervals that overlap, the means are not significantly different (at the P<0.05 level). Another version of this myth is that if each mean is outside the confidence interval of the other mean, the means are significantly different. Neither of these is true (Schenker and Gentleman 2001, Payton et al. 2003); it is easy for two sets of numbers to have overlapping confidence intervals, yet still be significantly different by a two-sample t–test; conversely, each mean can be outside the confidence interval of the other, yet they're still not significantly different. Don't try compare two means by visually comparing their confidence intervals, just use the correct statistical test.
⚠ Plotting the results and eyeballing the difference
This is a fine way to benchmark, actually! Sure, it's not exactly rigorous, but on the plus side it's pretty hard to screw up. However, this page is about running benchmarks as part of your CI, so anything which requires a human-in-the-loop is automatically out.
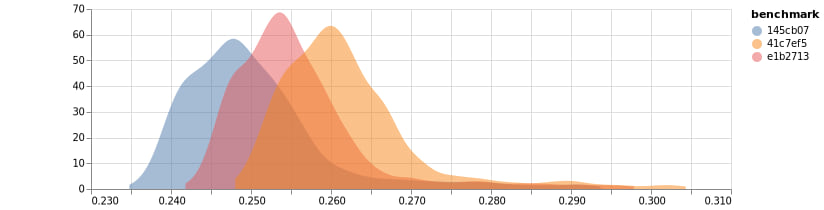
Do try plotting your raw benchmark data, though, just as a sanity check (especially when first setting up your benchmarking CI). You could plot histograms like at the top of this page, or violin plots, or a heatmap. Any of those will let you see at a glance how your benchmark is behaving. (FYI cbdr has functionality to help with this.)
⚠️ Beware "±"
Just because a benchmarking library prints its output with a "± x" doesn't mean it's computing a confidence interval. "±" often denotes a standard deviation, or some percentile; but it could mean anything, really. Having the standard deviation is well and good, but it doesn't exactly tell you whether your results are significant.
❌ Using profiling tools to benchmark
Consider your test suite. It's there to answer one question: "is it broken?". If the answer is "no" then you're good to go. If it comes back with a "yes", well, now we need to find out why the tests are broken - it's time to crack out the debugger and start poking around.
The same applies to benchmarking. If you want to know why your code is slow, then you may want to employ the heavy machinery: sample-based profiling, heap profiling, causal profiling, frame profiling, micro-benchmarks, CPU emulation, etc. etc..
But for CI purposes, we only need to answer the question: "did it get slower?". For this, all you need is one good macro-benchmark and a stopwatch.
❌ Checking too many variables
If your benchmark measures multiple things (eg. wall time and max RSS) then you probably want to check all of them to make sure that that nothing has regressed. Beware, however: the chance of a false positive will increase by a multiple of the number of values involved. You can counteract this by multiplying the widths of your CIs by the same number, but this means that they'll take longer to shrink.
Running all of your microbenchmarks in CI and comparing them individually sounds like a good idea ("I'll know which component got slower!"), but in practice you'll get so many false positives that you'll start ignoring CI failures. Instead, CI should just check overall performance. If there's a regression, you crack out the microbenchmarks to figure out what caused it.
❌ Concatenating results from different benchmarks
The method above involves running a "good macrobenchmark". Suppose you don't have one of those, but you do have lots of good microbenchmarks. How about we take a set of measurements separately for each benchmark and the combine them into a single set? (ie. concatenate the rows of the various csv files.)
There's a problem with this: the distribution of results probably won't be very normal; in fact it's likely to be highly multi-modal (aka. lumpy). You can compare these lumpy distributions to each other, but not with a t-test. You'll have to carefully find an appropriate test (probably a non-parametric one), and it will probably be a lot less powerful.
Instead, why not make a macrobenchmark which runs all of the microbenchmarks in sequence? This will take all your microbenchmarks into account, and give you a far more gaussian-looking distribution.
What about measuring instruction count?
Some people use CPU counters to measure retired instructions, CPU cycles, etc. as a proxy for wall time, in the hopes of getting more repeatable results. There are two things to consider:
- How well does your proxy correlate with wall time?
- How much better is the variance, compared to wall time?
In my experience, simply countring instructions doesn't correlate well enough, and counting CPU cycles is surprisingly high variance. If you go down this route I recommended you explore more sophisticated models, such as the one used by cachegrind.
If you do find a good proxy with less variance, then go for it! Your confidence intervals will converge faster.
Measuring small changes to a program
Nicholas Nethercote said this of instruction count:
You’d be mad to use it to compare the speed of two different programs, but it is very useful for comparing two slightly different versions of the same program, which are likely to have a similar instruction mix.
Making instruction count deterministic is impossible hard
The idea of swapping wall time for something 100% deterministic is very tempting, because it means you can do away with all this statistical nonsense and just compare two numbers. Sounds good, right?
A previous version of this document claimed that there is no deterministic measurement which is still a good proxy for wall time. However, the Rust project has recently made me eat my words.
Some recent work by the rustc people shows that it's possible to get instruction count variance down almost all the way to zero. It's very impressive stuff, and the writeup on the project is excellent - I recommend reading it.
If you want to try this yourself, the tl;dr is that you need to count instructions which retire in ring 3, and then subtract the number of timer-based hardware interrupts. You'll need:
- a Linux setup with ASLR disabled;
- a CPU with the necessary counters;
- a benchmark with deterministic control flow.
This last one is the catch. Normally when we say a program is "deterministic" we're referring to its observable output; but now the instruction count is part of the observable output!
What does this mean in practice? It means your program is allowed to look at the clock, /dev/urandom, etc... but it's not allowed to branch on those things. (Or, if it does, it had better make sure both branches have the same number of instructions.)
This is a very hard pill to swallow, much harder than "simply" producing deterministic output. For example, many hashmap implementations mix some randomness into their hashes. A program which uses such a hashmap may have the exact same behaviour every time it's run, but if you measure its instruction count it will be different on every run.
The rustc team have gone to great lengths to ensure that (single-threaded) rustc has this property. For example, at some point rustc prints its own PID, and the formatting code branches based on the number of digits in the PID. This was a measureable source of variance and had to be fixed by padding the formatted PID with spaces. Yikes!
The conclusion: it can be done; but if you're not willing to go all the way like the Rust project did, then IMO you should still be estimating a confidence interval.
lib.rs:
Time how long a process takes to run
Example
use std::{process::Command, time::Duration};
use time_cmd::*;

match time_cmd(Command::new("ls")) {
Err(_) => panic!("IO error - failed to run ls"),
Ok((timings, code)) => {
if !code.success() {
panic!("ls ran but exited non-zero");
}
if timings.wall_time > Duration::from_secs(1) {
panic!("That's a slow ls!");
}
}
}
Dependencies
~43KB