6 releases
| 0.2.4 | Mar 2, 2022 |
|---|---|
| 0.2.3 | Nov 29, 2021 |
| 0.2.2 | Jun 27, 2021 |
| 0.2.1 | Feb 1, 2021 |
| 0.1.0 | Nov 30, 2020 |
#271 in Profiling
380KB
1.5K
SLoC
CBDR
This repo contains a suite of tools called cbdr. You can install it like so:
cargo install cbdr
Usage
cbdr sample takes a list of benchmarks in the form name:program.
It randomly selects a benchmark, runs the program, reports the execution time,
and loops. The output is CSV-formatted and goes on forever. To get an idea
of what it looks like, let's pass it though head (to limit it) and column
(to format it):
$ cbdr sample "md5:md5sum $BIG_FILE" "sha1:sha1sum $BIG_FILE" "sha256:sha256sum $BIG_FILE" | head | column -ts,
Warming up md5...
Warming up sha1...
Warming up sha256...

benchmark  sys_time  user_time  wall_time
md5        0.01      0.12       0.131099686
sha1       0.03      0.13       0.155063893
sha256     0.02      0.32       0.344348186
sha256     0.01      0.32       0.335235973
md5        0         0.13       0.128056813
md5        0.01      0.13       0.130115718
md5        0.02      0.1        0.131369468
sha1       0         0.15       0.149611563
md5        0.01      0.12       0.128339435
cbdr analyze takes the output of cbdr sample and summarizes the differences
between the benchmarks.
$ cbdr analyze <results.csv
           md5            sha1           difference (99.9% CI)
sys_time   0.011 ± 0.007  0.011 ± 0.008  [ -14.7% ..  +17.5%]
user_time  0.116 ± 0.009  0.138 ± 0.009  [ +17.0% ..  +20.6%]
wall_time  0.128 ± 0.006  0.149 ± 0.006  [ +15.9% ..  +18.0%]
samples    392            410

           sha1           sha256         difference (99.9% CI)
sys_time   0.011 ± 0.008  0.012 ± 0.008  [ -12.0% ..  +20.0%]
user_time  0.138 ± 0.009  0.334 ± 0.013  [+139.6% .. +143.4%]
wall_time  0.149 ± 0.006  0.345 ± 0.011  [+129.8% .. +132.5%]
samples    410            422
Understanding the output
Let's take a look at this line:
           md5            sha1           difference (99.9% CI)
wall_time  0.128 ± 0.006  0.149 ± 0.006  [ +15.9% ..  +18.0%]
So, we have a set of wall-time measurements for "md5" (let's call the set
X) and a set of wall-time measurements for "sha1" (let's call it Y).
First we get the summary statistics for those sets:
mean(X) = 0.128 secsandstd_dev(X) = 0.006 secsmean(Y) = 0.149 secsandstd_dev(Y) = 0.006 secs
Then we get an estimate of the difference in the means
confidence_interval[mean(Y) - mean(X)] = [+0.02035 secs, +0.02304 secs]
But it's expressed as a percentage of the first mean:
- `confidence_interval[mean(Y) - mean(X)] / mean(X) = [+0.159, +0.18]
So you can understand the "[+15.9% .. +18.0%]" as meaning this: if you know how long md5 takes to run on average, then to get sha1's average running time you need to add on an extra x%, where x is somewhere between 15.9% and 18%.
Communicating the results
Let's look at the table comparing md5 to sha1. Judging by wall-clock time, sha1 looks like it's about 17% slower than md5, doesn't it? So we go ahead and tell our colleages:
I benchmarked sha1 against md5 and found that it was 17% slower.
Well, that's fine, but it's much better if we report the confidence interval instead!
By wall-clock time, sha1 was 16-18% slower than md5 (α=99.9%).
Now our colleages have some idea of how good the benchmark was. Note how
we also reported the alpha-value. cbdr analyze lets you customize this
parameter with the --significance option, but it defaults to 99.9%.
Now let's compare how much time md5sum and sha1sum spend inside the kernel. The difference is somewhere between -15% and +18%. Not only is this interval quite wide (implying a lot of variance), but it also straddles 0%. This means there isn't enough evidence to assert a real difference.
The difference in system time was within noise (α=99.9%)
Remember kids: practise statistical responsibility when communicating benchmark results!
Fancy features
You can pipe the output of cbdr sample directly into cbdr analyze to
see the confidence intervals change live as they're updated by new data.
$ cbdr sample --timeout=30s [benchmarks] | cbdr analyze
(Note: It's tempting to start a benchmark, watch the results come in, and then when you think you've collected enough you hit ctrl-C. If you do this the risk of biasing your results is very high. Decide your stopping point before you start the benchmark!)
If the command lines you're passing in are long, you might find it more convenient to write them one-per-line and pass them into xargs:
$ xargs cbdr sample >results.csv <<EOF
"md5:    md5sum    $BIG_FILE"
"sha1:   sha1sum   $BIG_FILE"
"sha256: sha256sum $BIG_FILE"
EOF
cbdr plot produces a vega-lite specification for vizualising benchmark
results.
$ cbdr plot <results.csv | vl2png | feh -
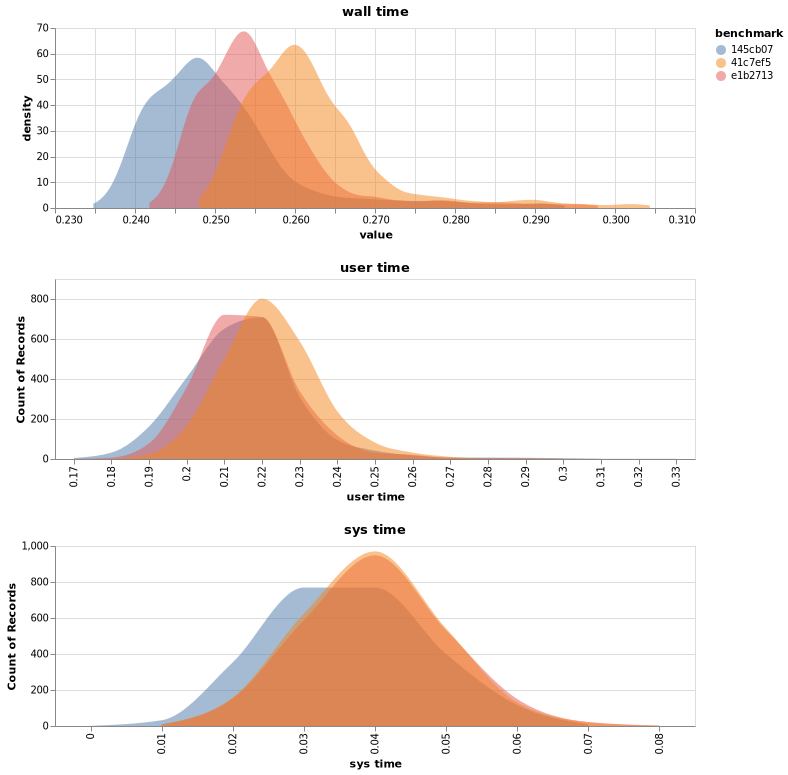
This can be useful for getting an idea of how gaussian your results are.
Custom measurements
cbdr can make use of custom measurement scripts. For instance, there's one
in bench_helpers/ which calls out to "perf stat" to get some fancier metrics:
./bench_helpers/perf-bench.sh 'git ls-files'
{
    "task_clock": 4.90,
    "cpu_utilization": 0.600,
    "context_switches": 1,
    "cpu_migrations": 0,
    "page_faults": 164,
    "cycles": 3875762,
    "instructions": 3859594,
    "branches": 881081,
    "branch_misses": 19461
}
You can tell cbdr to use such a script with the -b flag:
% cbdr sample -b bench_helpers/perf-bench.sh find 'git ls-files' | cbdr analyze
Warming up find...
Warming up git ls-files...

                  find                       git ls-files              difference (99.9% CI)
branch_misses     126177.219 ± 4491.457      18969.948 ± 309.242       [ -85.3% ..  -84.6%]
branches          7124422.062 ± 10084.975    880096.793 ± 4663.410     [ -87.7% ..  -87.6%]
context_switches  1.096 ± 1.557              0.117 ± 0.356             [-103.3% ..  -75.4%]
cpu_migrations    0.003 ± 0.058              0.000 ± 0.000             [   NaN% ..    NaN%]
cpu_utilization   0.947 ± 0.010              0.654 ± 0.022             [ -31.2% ..  -30.7%]
cycles            44041299.653 ± 979069.887  4108837.580 ± 190263.302  [ -90.9% ..  -90.5%]
instructions      36138254.480 ± 59172.510   3854234.597 ± 24108.835   [ -89.4% ..  -89.3%]
page_faults       146.617 ± 2.193            164.714 ± 1.883           [ +12.2% ..  +12.5%]
task_clock        14.901 ± 3.714             1.434 ± 0.560             [ -92.8% ..  -88.0%]
samples           1189                       1268
Dependencies
~10–20MB
~242K SLoC