14 releases (7 stable)
| 2.1.0 | Mar 12, 2024 |
|---|---|
| 2.0.2 | Oct 2, 2023 |
| 2.0.1 | Dec 3, 2022 |
| 1.0.2 | Nov 27, 2021 |
| 0.1.4 | Dec 31, 2020 |
#162 in Science
255KB
1.5K
SLoC
starry
A tool to store the counts of GitHub stars, and also be notified about what's new and rising
Why
Did you notice all those tools pretending to graph the numbers of stars on repositories never show anything going down ?
That's because you've been lied to: those tools only show the current stars, with their age. Because that's the only information you can get with the GitHub API.
If you want to see the real stars graph there's no other solution than to regularly query and store the numbers. That's what this tool does.
Because the history of current stars tells only half the starry.
Installation
You must have Rust installed. Do
cargo install starry
Usage
In order to query the GitHub API, you must register your API token:
starry set github_api_token your-token
(see https://docs.github.com/en/free-pro-team@latest/github/authenticating-to-github/creating-a-personal-access-token for creation)
You need to say what user(s) you want to follow:
starry follow dtolnay
starry follow ralt
Fetching the stars is done with
starry
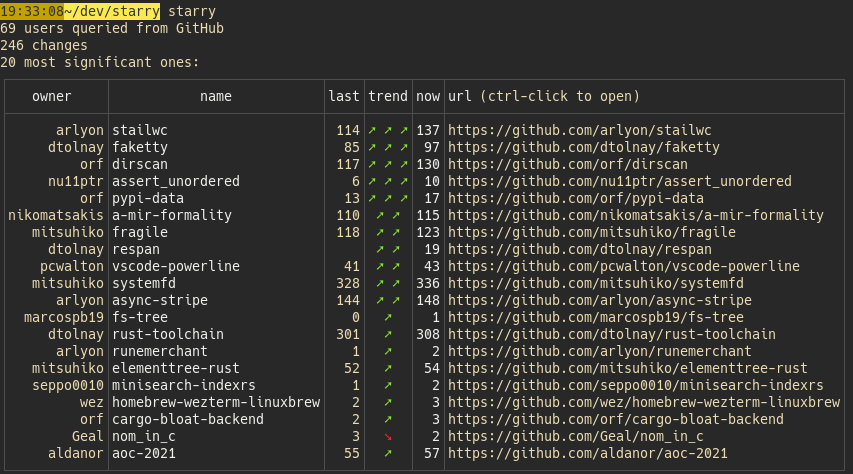
Starry will tell you about new repositories and rising or fading stars:

If you just want to know from time to time what your friends are up to, you don't need more.
If you want regular data, you should probably add a cron rule.
Data are stored in clear in CSV files (if you're on linux, they're in ~/.local/share/starry/stars.
Those files can be used as is.
If you want time series, for example to graph them, you may extract them as csv with the extract subcommand:
starry extract shepmaster ralt BurntSushi dtolnay dtolnay/anyhow > test.csv
In this query we want to get the time series of 4 users (meaning their total number of stars) and one repository.
Here's an example of result:

You may graph the data with csv2svg:
If you run
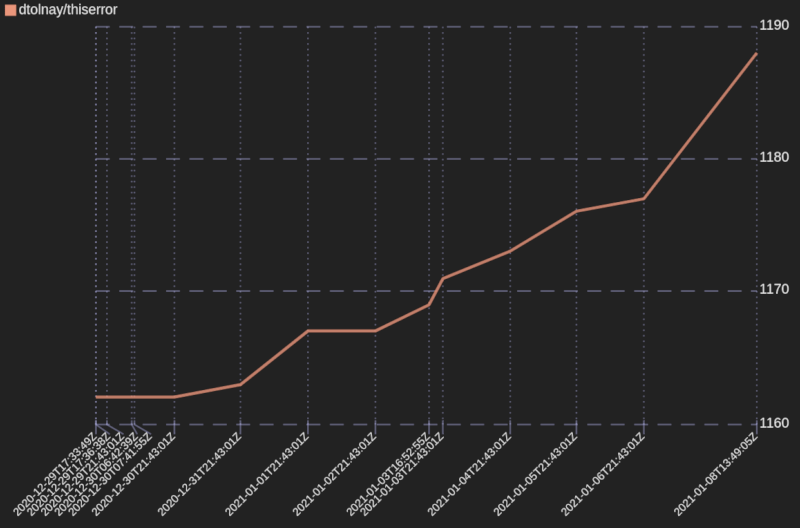
starry extract dtolnay/thiserror | csv2svg
then your browser displays a graph like this:

You may display several entries, like starry extract dtolnay/thiserror dtolnay/anyhow | csv2svg
Starry Online
A limited version of Starry can be seen at https://dystroy.org/starnet/.
Dependencies
~15–29MB
~399K SLoC