16 releases
| 0.4.4 | Jan 11, 2025 |
|---|---|
| 0.4.3 | Aug 15, 2024 |
| 0.4.1 | Jan 29, 2024 |
| 0.3.6 | Oct 16, 2023 |
| 0.2.2 | Mar 28, 2021 |
#47 in Profiling
611 downloads per month
Used in 4 crates
1.5MB
1.5K
SLoC
![]()
![]()
![]()
![]()
Glassbench is a micro-benchmark library with memory, to use with cargo bench.
Why
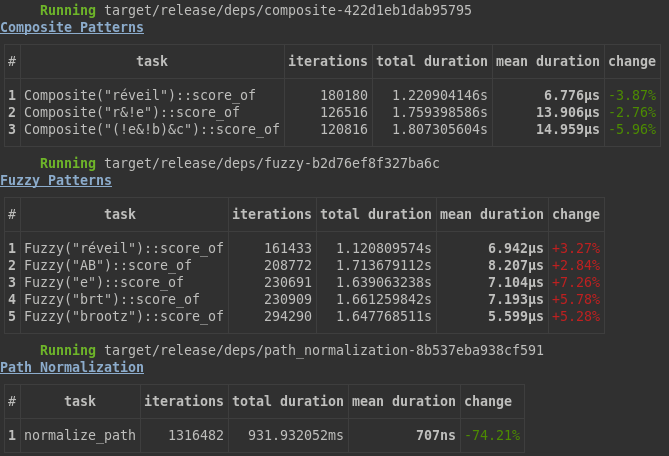
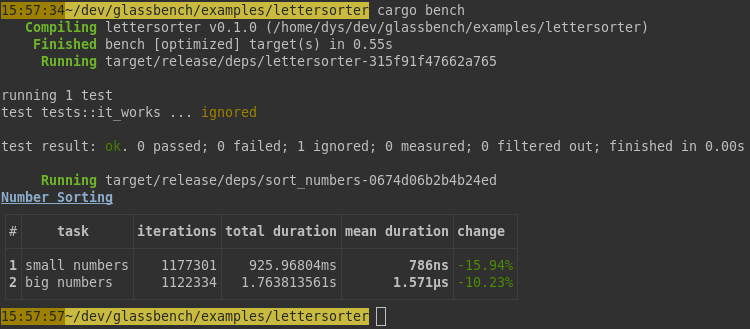
Run benchmarks and get a comparison with the previous execution
cargo bench
You get compact tables with the mean durations of all the tasks you defined:
Record every tests, with tags to help you compare strategies
Read the whole history of your project's benchmarks, as everything is stored in SQLite.
cargo bench -- -- --history 2
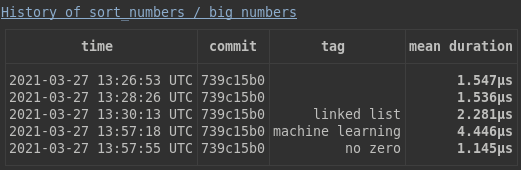
When trying optimization strategies, or just anything which you suspect may impact performance, you may tag a bench execution:
cargo bench -- -- --tag "no zero"
Graph your various tests, filtering on tags
Open the grapher:
cargo bench -- -- --graph
(yes, there are two -- before --graph)
Graph a specific task:
cargo bench -- my_task -- --graph 2
The viewer, with tabular and graphical views, opens in your browser:
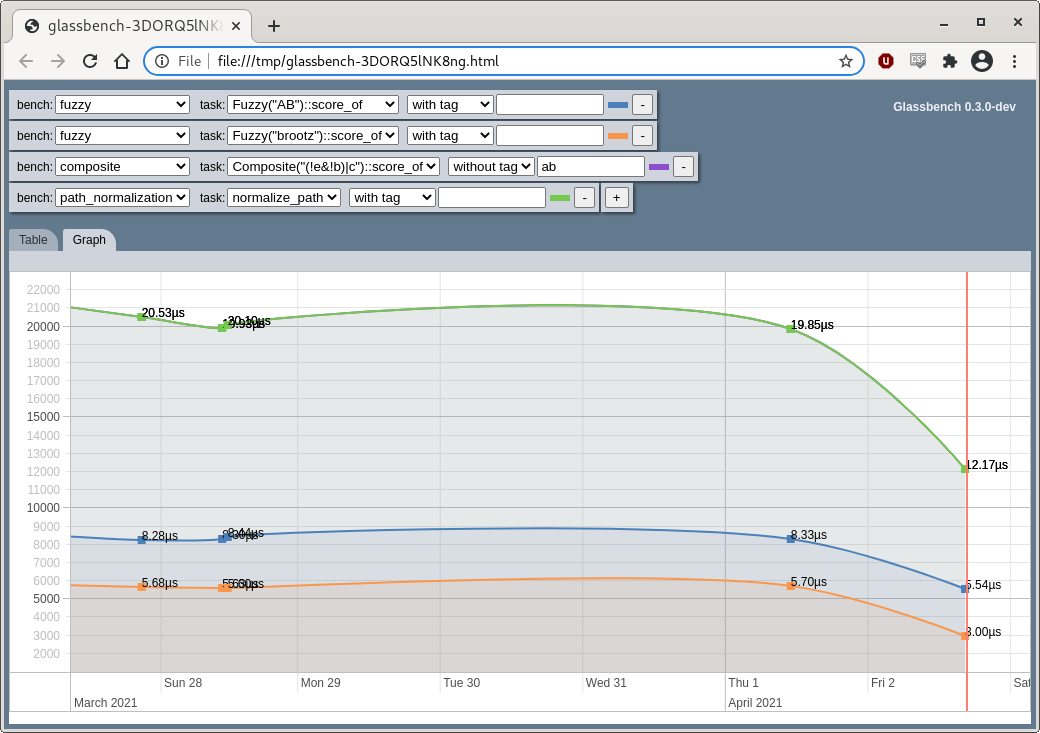
The graph can be zoomed with the mouse wheel and moved with the mouse.
You can read the precise data in a table too:
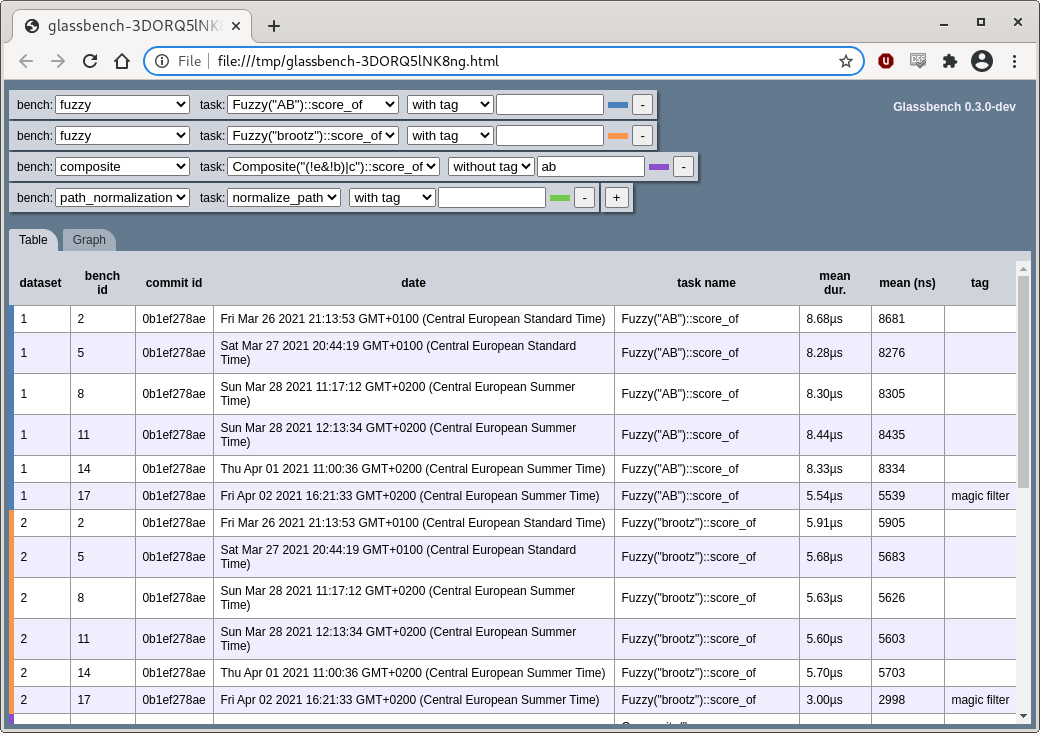
Everything is embedded in a standalone HTML page, there's no process running. The page can even be sent or hosted.
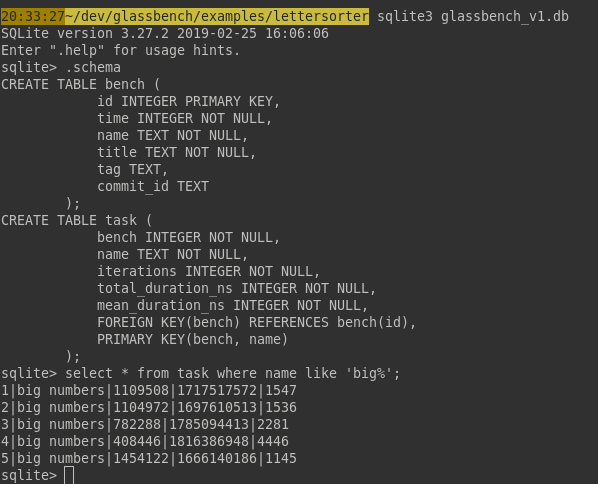
Read or Edit benchmark history with SQL
Using the sqlite3 command line shell, you can run your own SQL queries:
You may remove the benchmarks of a period if you like, change tags a posteriori, etc.
If you want to get rid of the whole histoyr, you can simply delete the glassbench_v1.db file.
Usage
The complete testable example is in /examples/lettersorter.
Add the dev-dependency
[dev-dependencies]
glassbench = "0.3"
Prepare the benchmark
Your bench file, located in /benches, must have a task defining function and a glassbench! call.
Here we define one group, with two tasks, stressing the lettersort::sort function with two kinds of inputs.
use {
    lettersorter::sort,
    glassbench::*,
};

static SMALL_NUMBERS: &[&str] = &[
    "0.123456789",
    "42",
    "-6",
    "π/2",
    "e²",
];

static BIG_NUMBERS: &[&str] = &[
    "424568",
    "45865452*44574*778141*78999",
    "same but even bigger",
    "42!",
    "infinite",
];

fn bench_number_sorting(bench: &mut Bench) {
    bench.task("small numbers", |task| {
        task.iter(|| {
            for n in SMALL_NUMBERS {
                pretend_used(sort(n));
            }
        });
    });
    bench.task("big numbers", |task| {
        task.iter(|| {
            for n in BIG_NUMBERS {
                pretend_used(sort(n));
            }
        });
    });
}

glassbench!(
    "Number Sorting",
    bench_number_sorting,
    // you can pass other task defining functions here
);
The callback you give to b.iter will be executed many times after an initial warming.
If you have some preparation to do, do it before b.iter.
To prevent your function to be optimized away by the compiler, pass the values you build to pretend_used.
The bench must be defined in Cargo.toml with harness = false:
[[bench]]
name = "sort_numbers"
harness = false
Until you finished preparing your benchmark, you probably don't want to save the results so you'll run glassbench with
cargo bench -- -- --no-save
Bench command overview
The command has the following form:
cargo bench -- <optional list of benchs to run> -- <glassbench arguments>
The names of the benchs are the names of the bench files (see examples below).
The glassbench arguments let you display the history or graph the records for a specific task, specify a tag, etc.
Run all benchmarks
cargo bench
This will run all benchmarks groups (even the ones not using Glassbench) and will produce something like this after a few tries and some optimization efforts:
Be careful that you should not stress your system otherwise if you want to be able to compare executions. It's better to close everything else until it's done.
Run just one benchmark
Specify the id of the benchmark (taken from the bench file name) after --
cargo bench -- sort_numbers
(as our example only has one benchmark, it's useless)
You could specify several benchmarks like this:
cargo bench -- sort_numbers sort_colors sort_flowers
Benchmark with a tag
Let's assume we're trying with notable conditions, maybe a genius strategy, then we may want to have this information in the history. We can do
cargo bench -- sort_numbers -- --tag "deep learning"
Look at the history of a specific task
You refer to a task by its number in the table:
cargo bench -- sort_numbers --history 1
Graph a task over executions
Addition arguments are given after a second --. To graph a task, refer to it by its number in the table:
cargo bench -- sort_numbers -- --graph 1
This opens in your browser a graph of the durations in nanoseconds of the first (1) task of the "sort_numbers" bench.
(note: the graph is a work in progress and should be improved in the future)
Other arguments
--no-save just runs the benchmark, and compares with the previous saved execution, but doesn't save the result:
cargo bench -- -- --no-save
Read (or rewrite) the history with SQLite
History is saved in the local glassbench_v1.db sqlite3 file.
You should put its path in your vcs ignore list as measures can't be compared from one system to other ones.
To enter an interactive SQL session, do
sqlite3 glassbench_v1.db
Besides SQL queries, you might find useful .schema, which shows you the tables, and .quit.
Limits
Glassbench measures the time really taken by your functions. It's the time which matters for your users but it's extremely sensible to the load of your system and can't be compared from one computer to another one.
You must be cautious when looking at the history. Changes may be related to more than just your code efficiency: even if you didn't change the task, there may have been changes in your system load or efficiency.
Alternatives
Criterion is very similar. It produces detailed reports, and has more options than Glassbench, but doesn't have an history past the previous cargo bench (which is usually the one you most want). Glassbench tries to offer a more compact and easier to read display and encourages you to define as many tasks as your can have performance impacting kinds of inputs.
License
MIT
Dependencies
~55MB
~1M SLoC