4 releases
Uses old Rust 2015
| 0.0.4 | Dec 16, 2016 |
|---|---|
| 0.0.3 | Dec 14, 2016 |
| 0.0.2 | Dec 13, 2016 |
| 0.0.1 | Dec 13, 2016 |
#340 in Visualization
365 downloads per month
55KB
605 lines
rustplotlib 


A tiny library for creating 2D charts, by using matplotlib.
This project is inspired by mneumann's matplotlib-rs, and SiegeLord's RustGnuplot.
WARNING
This project is currently under the development. It means that some broken changes will be occurred in API.
The development version of API documentation is here.
Features
- builder style API
- support for multiple backends
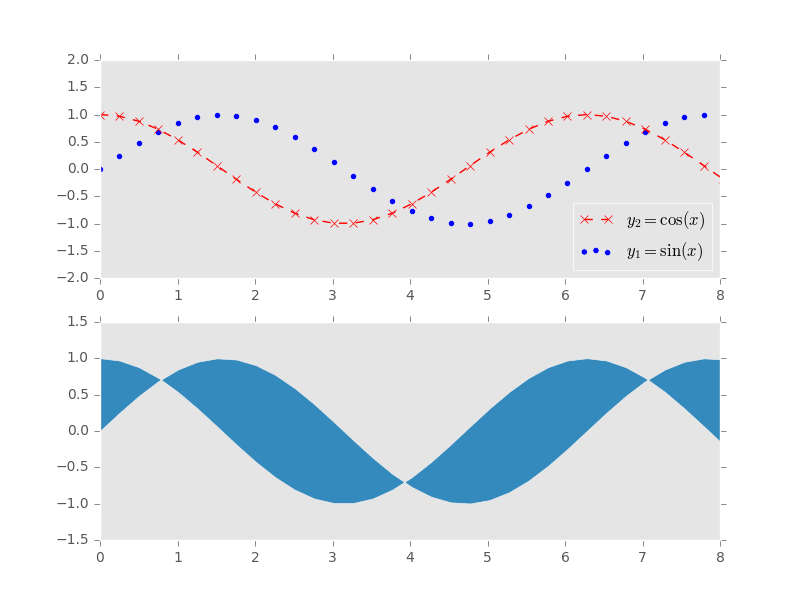
Example
extern crate rustplotlib;

use rustplotlib::Figure;

fn make_figure<'a>(x: &'a [f64], y1: &'a [f64], y2: &'a [f64]) -> Figure<'a> {
  use rustplotlib::{Axes2D, Scatter, Line2D, FillBetween};

  let ax1 = Axes2D::new()
    .add(Scatter::new(r"$y_1 = \sin(x)$")
      .data(x, y1)
      .marker("o"))
    .add(Line2D::new(r"$y_2 = \cos(x)$")
      .data(x, y2)
      .color("red")
      .marker("x")
      .linestyle("--")
      .linewidth(1.0))
    .xlabel("Time [sec]")
    .ylabel("Distance [mm]")
    .legend("lower right")
    .xlim(0.0, 8.0)
    .ylim(-2.0, 2.0);

  let ax2 = Axes2D::new()
    .add(FillBetween::new()
      .data(x, y1, y2)
      .interpolate(true))
    .xlim(0.0, 8.0)
    .ylim(-1.5, 1.5);

  Figure::new()
    .subplots(2, 1, vec![Some(ax1), Some(ax2)])
}

fn main() {
  use std::f64::consts::PI;
  let x: Vec<f64> = (0..40).into_iter().map(|i| (i as f64) * 0.08 * PI).collect();
  let y1: Vec<f64> = x.iter().map(|x| x.sin()).collect();
  let y2: Vec<f64> = x.iter().map(|x| x.cos()).collect();

  let fig = make_figure(&x, &y1, &y2);

  use rustplotlib::Backend;
  use rustplotlib::backend::Matplotlib;
  let mut mpl = Matplotlib::new().unwrap();
  mpl.set_style("ggplot").unwrap();

  fig.apply(&mut mpl).unwrap();

  mpl.savefig("simple.png").unwrap();
  mpl.dump_pickle("simple.fig.pickle").unwrap();
  mpl.wait().unwrap();
}
See examples/simple.rs for details.
License
This software is released under the MIT license. See LICENSE for details.