19 releases
| 0.20.14 | Jul 10, 2024 |
|---|---|
| 0.20.13 | Jul 3, 2024 |
| 0.20.12 | Jun 29, 2024 |
#102 in Visualization
1,038 downloads per month
42KB
765 lines
Visualize Yew
![]()
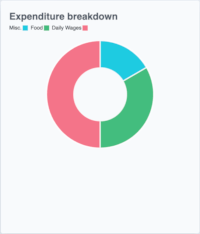
This is a simple crate to help you visualize your data in the browser using Yew. It is a wrapper around the yew crate that provides a simple API to create charts.
Note: This crate is NOW available for use, all charts are customizable to your liking.
New/Upcoming Features:
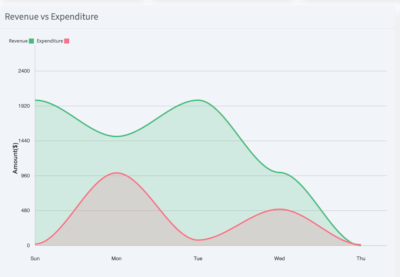
- Area Chart
- Customizable tooltip for all charts
- Toggleable legend for all charts
- Polar Area Chart
- Radar Chart
- Scatter Chart
This crate is built using the Yew framework and uses HTML5 canvas to render the charts.
Features
-
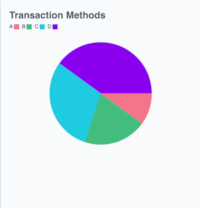
PieChart
-
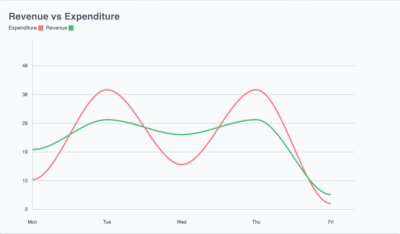
LineChart
-
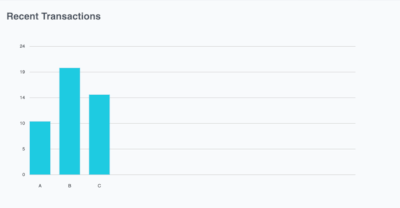
BarChart
-
DoughnutChart
Usage
Add the following to your Cargo.toml:
[dependencies]
visualize-yew = { version = "0.20.x", features = ["PieChart"] }
Example
use visualize_yew::pie_chart::{DataPoint as PieChartData, PieChart};

#[function_component]
fn Home() -> Html {
    let mut pie_chart_config = PieChartConfig::default();
    pie_chart_config.show_legend = true;

    let pie_data = vec![
        PieDataPoint {
            name: "A".to_string(),
            value: 10,
            color: "#F47489".to_string(),
        },
        PieDataPoint {
            name: "B".to_string(),
            value: 20,
            color: "#43bc7e".to_string(),
        },
        PieDataPoint {
            name: "C".to_string(),
            value: 30,
            color: "#1ECBE1".to_string(),
        },
        PieDataPoint {
            name: "D".to_string(),
            value: 40,
            color: "#8900ef".to_string(),
        },
    ];

    html! {
        // Chart will take the full width of the parent container
        <div>
            <PieChart data={pie_chart_data} config={pie_chart_config} />
        </div>
    }
}
License
This project is licensed under both the MIT license and the Apache License (Version 2.0).
Contribution
Unless you explicitly state otherwise, any contribution intentionally submitted for inclusion in this project by you, shall be dual licensed as above, without any additional terms or conditions.
Acknowledgements
This project is inspired by the Chart.js library for JavaScript.
Dependencies
~12–20MB
~273K SLoC