48 releases (26 stable)
| 1.13.0 | Feb 9, 2025 |
|---|---|
| 1.11.0 | Jan 1, 2025 |
| 1.10.1 | Sep 29, 2024 |
| 1.2.1 | Jul 31, 2024 |
| 0.2.4 | Oct 13, 2021 |
#60 in Math
771 downloads per month
Used in 15 crates
715KB
6.5K
SLoC
Rust plotting library using Python (Matplotlib)
![]()
![]()
Contents
Introduction
This crate implements high-level functions to generate plots and drawings. Although we use Python/Matplotlib, the goal is to provide a convenient Rust library that is different than Matplotlib. The difference happens because we want convenience for the Rust developer while getting the fantastic quality of Matplotlib 😀.
Plotpy is more verbose than Matplotlib because we aim to minimize the need to memorize the functionality by taking advantage of the intelligence of the IDE (e.g., VS Code) on auto-completing the code.
Internally, we use Matplotlib via a Python 3 script. First, we generate a python code in a directory of your choice (e.g., /tmp/plotpy), and then we call python3 using Rust's std::process::Command.
For more information (and examples), check out the plotpy documentation on docs.rs.
See also the examples directory with the output of the integration tests.
Installation
This code is mainly tested on Debian/Ubuntu/Linux.
This crate needs Python3 and Matplotlib, of course.
On Debian/Ubuntu/Linux, run:
sudo apt install python3-matplotlib
Important: The Rust code will call python3 via std::process::Command. However, there is an option to call a different python executable; for instance (the code below is no tested):
let mut plot = Plot::new();
plot.set_python_exe("C:\Windows11\WhereIs\python.exe")
    .add(...)
    .save(...)?;
Setting Cargo.toml
![]()
👆 Check the crate version and update your Cargo.toml accordingly:
[dependencies]
plotpy = "*"
Use of Jupyter via evcxr
Plotpy can be used with Jupyter via evcxr. Thus, it can interactively display the plots in a Jupyter Notebook. This feature requires the installation of evcxr. See the Jupyter/evcxr article.
The following code shows a minimal example (not tested)
// set the python path
let python = "where-is-my/python";

// set the figure path and name to be saved
let path = "my-figure.svg";

// plot and show in a Jupyter notebook
let mut plot = Plot::new();
plot.set_python_exe(python)
    .set_label_x("x")
    .set_label_y("y")
    .show_in_jupyter(path)?;
Examples
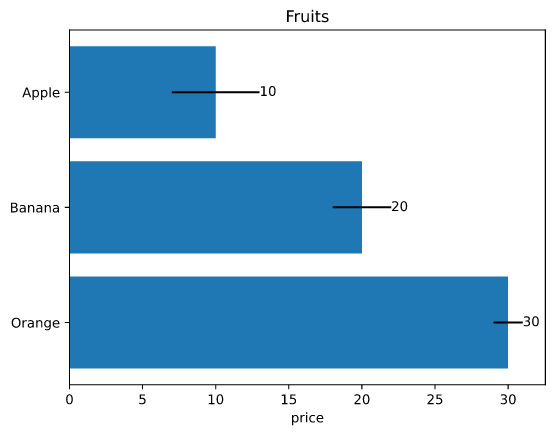
Barplot
use plotpy::{Barplot, Plot, StrError};

fn main() -> Result<(), StrError> {
    // data
    let fruits = ["Apple", "Banana", "Orange"];
    let prices = [10.0, 20.0, 30.0];
    let errors = [3.0, 2.0, 1.0];

    // barplot object and options
    let mut bar = Barplot::new();
    bar.set_errors(&errors)
        .set_horizontal(true)
        .set_with_text("edge")
        .draw_with_str(&fruits, &prices);

    // save figure
    let mut plot = Plot::new();
    plot.set_inv_y()
        .add(&bar)
        .set_title("Fruits")
        .set_label_x("price");

    // plot.save("/tmp/plotpy/doc_tests/doc_barplot_3.svg")?;
    Ok(())
}
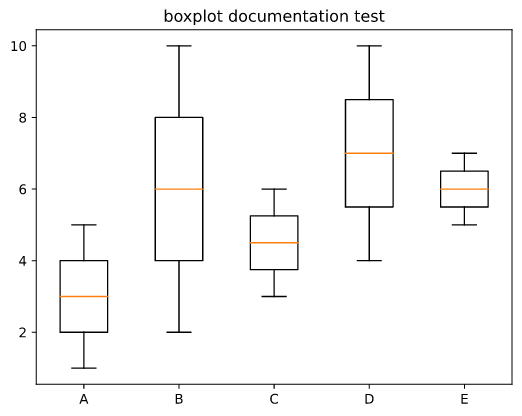
Boxplot
use plotpy::{Boxplot, Plot, StrError};

fn main() -> Result<(), StrError> {
    // data (as a nested list)
    let data = vec![
        vec![1, 2, 3, 4, 5],              // A
        vec![2, 3, 4, 5, 6, 7, 8, 9, 10], // B
        vec![3, 4, 5, 6],                 // C
        vec![4, 5, 6, 7, 8, 9, 10],       // D
        vec![5, 6, 7],                    // E
    ];

    // x ticks and labels
    let n = data.len();
    let ticks: Vec<_> = (1..(n + 1)).into_iter().collect();
    let labels = ["A", "B", "C", "D", "E"];

    // boxplot object and options
    let mut boxes = Boxplot::new();
    boxes.draw(&data);

    // save figure
    let mut plot = Plot::new();
    plot.add(&boxes)
        .set_title("boxplot documentation test")
        .set_ticks_x_labels(&ticks, &labels);

    // plot.save("/tmp/plotpy/doc_tests/doc_boxplot_2.svg")?;
    Ok(())
}
Canvas
use plotpy::{Canvas, Plot, PolyCode, StrError};

fn main() -> Result<(), StrError> {
    // codes
    let data = [
        (3.0, 0.0, PolyCode::MoveTo),
        (1.0, 1.5, PolyCode::Curve4),
        (0.0, 4.0, PolyCode::Curve4),
        (2.5, 3.9, PolyCode::Curve4),
        (3.0, 3.8, PolyCode::LineTo),
        (3.5, 3.9, PolyCode::LineTo),
        (6.0, 4.0, PolyCode::Curve4),
        (5.0, 1.5, PolyCode::Curve4),
        (3.0, 0.0, PolyCode::Curve4),
    ];

    // polycurve
    let mut canvas = Canvas::new();
    canvas.set_face_color("#f88989").set_edge_color("red");
    canvas.polycurve_begin();
    for (x, y, code) in data {
        canvas.polycurve_add(x, y, code);
    }
    canvas.polycurve_end(true);

    // add canvas to plot
    let mut plot = Plot::new();
    plot.add(&canvas);

    // save figure
    plot.set_range(1.0, 5.0, 0.0, 4.0)
        .set_frame_borders(false)
        .set_hide_axes(true)
        .set_equal_axes(true)
        .set_show_errors(true);

    // plot.save("/tmp/plotpy/doc_tests/doc_canvas_polycurve.svg")?;
    Ok(())
}

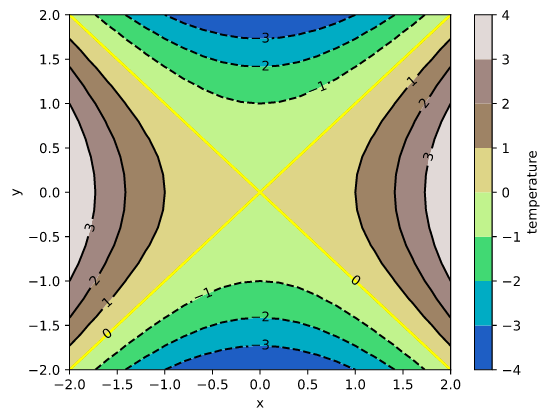
Contour
use plotpy::{generate3d, Contour, Plot, StrError};

fn main() -> Result<(), StrError> {
    // generate (x,y,z) matrices
    let n = 21;
    let (x, y, z) = generate3d(-2.0, 2.0, -2.0, 2.0, n, n, |x, y| x * x - y * y);

    // configure contour
    let mut contour = Contour::new();
    contour
        .set_colorbar_label("temperature")
        .set_colormap_name("terrain")
        .set_selected_level(0.0, true);

    // draw contour
    contour.draw(&x, &y, &z);

    // add contour to plot
    let mut plot = Plot::new();
    plot.add(&contour)
        .set_labels("x", "y");

    // plot.save("/tmp/plotpy/readme_contour.svg")?;
    Ok(())
}
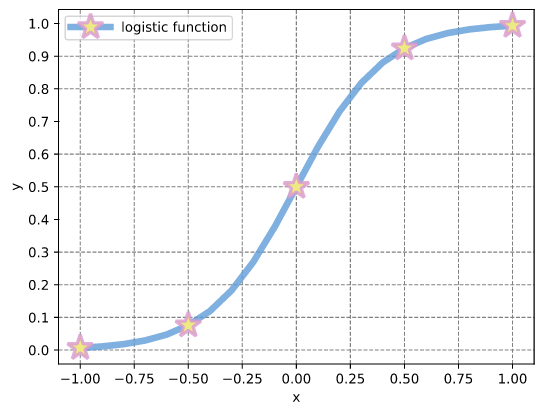
Curve
use plotpy::{linspace, Curve, Plot, StrError};

fn main() -> Result<(), StrError> {
    // generate (x,y) points
    let x = linspace(-1.0, 1.0, 21);
    let y: Vec<_> = x.iter().map(|v| 1.0 / (1.0 + f64::exp(-5.0 * *v))).collect();

    // configure curve
    let mut curve = Curve::new();
    curve
        .set_label("logistic function")
        .set_line_alpha(0.8)
        .set_line_color("#5f9cd8")
        .set_line_style("-")
        .set_line_width(5.0)
        .set_marker_color("#eeea83")
        .set_marker_every(5)
        .set_marker_line_color("#da98d1")
        .set_marker_line_width(2.5)
        .set_marker_size(20.0)
        .set_marker_style("*");

    // draw curve
    curve.draw(&x, &y);

    // add curve to plot
    let mut plot = Plot::new();
    plot.add(&curve)
        .set_num_ticks_y(11)
        .grid_labels_legend("x", "y");

    // plot.save("/tmp/plotpy/doc_tests/doc_curve.svg")?;
    Ok(())
}
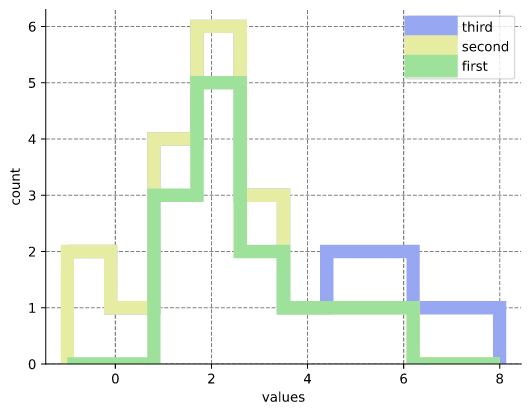
Histogram
use plotpy::{Histogram, Plot, StrError};

fn main() -> Result<(), StrError> {
    // set values
    let values = vec![
        vec![1, 1, 1, 2, 2, 2, 2, 2, 3, 3, 4, 5, 6], // first series
        vec![-1, -1, 0, 1, 2, 3],                    // second series
        vec![5, 6, 7, 8],                            // third series
    ];

    // set labels
    let labels = ["first", "second", "third"];

    // configure and draw histogram
    let mut histogram = Histogram::new();
    histogram.set_colors(&["#9de19a", "#e7eca3", "#98a7f2"])
        .set_line_width(10.0)
        .set_stacked(true)
        .set_style("step");
    histogram.draw(&values, &labels);

    // add histogram to plot
    let mut plot = Plot::new();
    plot.add(&histogram)
        .set_frame_border(true, false, true, false)
        .grid_labels_legend("values", "count");

    // plot.save("/tmp/plotpy/doc_tests/doc_histogram.svg")?;
    Ok(())
}
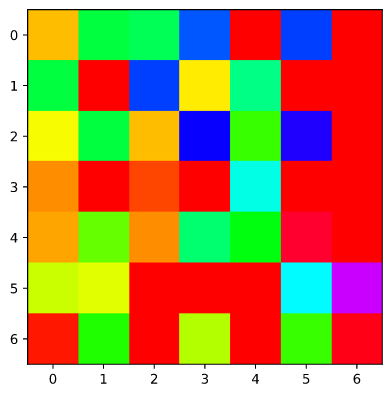
Image
use plotpy::{Image, Plot, StrError};

fn main() -> Result<(), StrError> {
    // set values
    let data = [
        [0.8, 2.4, 2.5, 3.9, 0.0, 4.0, 0.0],
        [2.4, 0.0, 4.0, 1.0, 2.7, 0.0, 0.0],
        [1.1, 2.4, 0.8, 4.3, 1.9, 4.4, 0.0],
        [0.6, 0.0, 0.3, 0.0, 3.1, 0.0, 0.0],
        [0.7, 1.7, 0.6, 2.6, 2.2, 6.2, 0.0],
        [1.3, 1.2, 0.0, 0.0, 0.0, 3.2, 5.1],
        [0.1, 2.0, 0.0, 1.4, 0.0, 1.9, 6.3],
    ];

    // image plot and options
    let mut img = Image::new();
    img.set_colormap_name("hsv").draw(&data);

    // save figure
    let mut plot = Plot::new();
    plot.add(&img);

    // plot.save("/tmp/plotpy/doc_tests/doc_image_1.svg")?;
    Ok(())
}
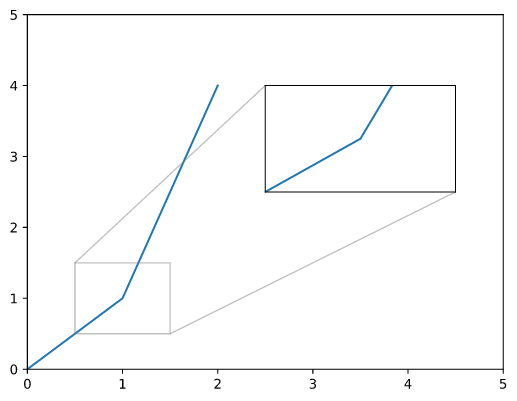
InsetAxes
use plotpy::{Curve, InsetAxes, Plot, StrError};

fn main() -> Result<(), StrError> {
    // draw curve
    let mut curve = Curve::new();
    curve.draw(&[0.0, 1.0, 2.0], &[0.0, 1.0, 4.0]);

    // allocate inset and add curve to it
    let mut inset = InsetAxes::new();
    inset
        .add(&curve) // add curve to inset
        .set_range(0.5, 1.5, 0.5, 1.5) // set the range of the inset
        .draw(0.5, 0.5, 0.4, 0.3);

    // add curve and inset to plot
    let mut plot = Plot::new();
    plot.add(&curve)
        .set_range(0.0, 5.0, 0.0, 5.0)
        .add(&inset); // IMPORTANT: add inset after setting the range

    // plot.save("/tmp/plotpy/doc_tests/doc_inset_axes_add.svg")?;
    Ok(())
}
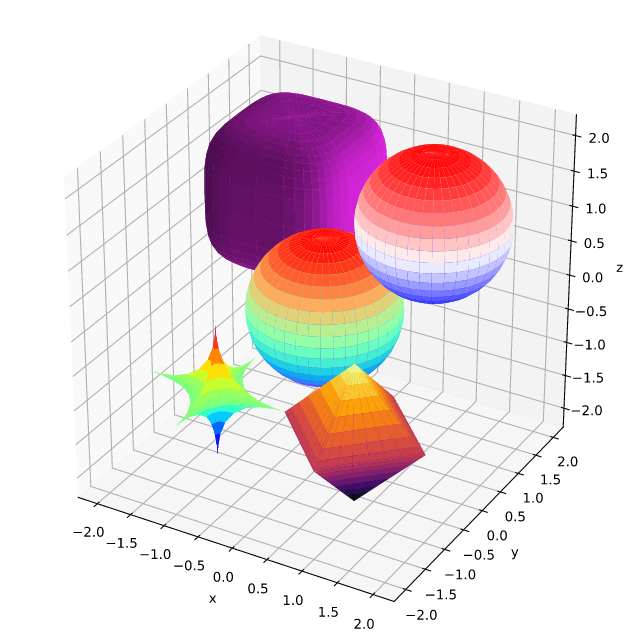
Surface
use plotpy::{Plot, StrError, Surface};

fn main() -> Result<(), StrError> {
    // star
    let r = &[1.0, 1.0, 1.0];
    let c = &[-1.0, -1.0, -1.0];
    let k = &[0.5, 0.5, 0.5];
    let mut star = Surface::new();
    star.set_colormap_name("jet")
        .draw_superquadric(c, r, k, -180.0, 180.0, -90.0, 90.0, 40, 20)?;

    // pyramids
    let c = &[1.0, -1.0, -1.0];
    let k = &[1.0, 1.0, 1.0];
    let mut pyramids = Surface::new();
    pyramids
        .set_colormap_name("inferno")
        .draw_superquadric(c, r, k, -180.0, 180.0, -90.0, 90.0, 40, 20)?;

    // rounded cube
    let c = &[-1.0, 1.0, 1.0];
    let k = &[4.0, 4.0, 4.0];
    let mut cube = Surface::new();
    cube.set_surf_color("#ee29f2")
        .draw_superquadric(c, r, k, -180.0, 180.0, -90.0, 90.0, 40, 20)?;

    // sphere
    let c = &[0.0, 0.0, 0.0];
    let k = &[2.0, 2.0, 2.0];
    let mut sphere = Surface::new();
    sphere
        .set_colormap_name("rainbow")
        .draw_superquadric(c, r, k, -180.0, 180.0, -90.0, 90.0, 40, 20)?;

    // sphere (direct)
    let mut sphere_direct = Surface::new();
    sphere_direct.draw_sphere(&[1.0, 1.0, 1.0], 1.0, 40, 20)?;

    // add features to plot
    let mut plot = Plot::new();
    plot.add(&star)
        .add(&pyramids)
        .add(&cube)
        .add(&sphere)
        .add(&sphere_direct);

    // save figure
    plot.set_equal_axes(true)
        .set_figure_size_points(600.0, 600.0);

    // plot.save("/tmp/plotpy/readme_superquadric.svg")?;
    Ok(())
}
Text
use plotpy::{Plot, Text, StrError};
use std::path::Path;

fn main() -> Result<(), StrError> {
    // configure text
    let mut text = Text::new();
    text.set_color("purple")
        .set_align_horizontal("center")
        .set_align_vertical("center")
        .set_fontsize(30.0)
        .set_bbox(true)
        .set_bbox_facecolor("pink")
        .set_bbox_edgecolor("black")
        .set_bbox_alpha(0.3)
        .set_bbox_style("roundtooth,pad=0.3,tooth_size=0.2");

    // draw text
    text.draw_3d(0.5, 0.5, 0.5, "Hello World!");

    // add text to plot
    let mut plot = Plot::new();
    plot.add(&text);

    // plot.save("/tmp/plotpy/doc_tests/doc_text.svg")?;
    Ok(())
}
