84 releases (25 breaking)
| new 0.25.1 | May 19, 2025 |
|---|---|
| 0.24.0 | Mar 18, 2025 |
| 0.22.0 | Sep 27, 2024 |
| 0.20.0 | Apr 16, 2024 |
| 0.7.6 | Jul 27, 2023 |
#63 in GUI
847 downloads per month
Used in lexviz
110KB
2.5K
SLoC
![]()
egui_graphs
Graph visualization with rust, petgraph and egui in its DNA.
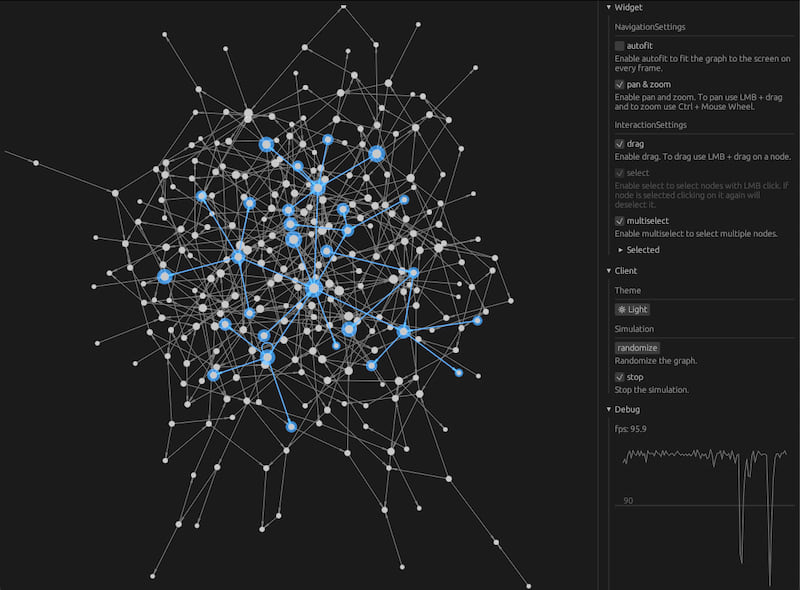
The project implements a Widget for the egui framework, enabling easy visualization of interactive graphs in rust. The goal is to implement the very basic engine for graph visualization within egui, which can be easily extended and customized for your needs.
- Visualization of any complex graphs;
- Zooming and panning;
- Node and Edge labels;
- Node and edges interactions and events reporting: click, double click, select, drag;
- Style configuration via egui context styles;
- Dark/Light theme support via egui context styles;
- Events reporting to extend the graph functionality by the user handling them;
- Layots and custom layout mechanism;
Status
The project is on track for a stable release v1.0.0. For the moment, breaking releases are very possible.
Please use master branch for the latest updates.
Check the demo example for the comprehensive overview of the widget possibilities.
Layouts
In addition to the basic graph display functionality, the project provides a layout mechanism to arrange the nodes in the graph. The Layout trait can be implemented by the library user allowing for custom layouts. The following layouts are coming from the box:
- Random layout;
- Hierarchical layout;
- Force-directed layout; (coming soon)

Check the layouts example.
Examples
Basic setup example
The source code of the following steps can be found in the basic example.
Step 1: Setting up the BasicApp struct.
First, let's define the BasicApp struct that will hold the graph.
pub struct BasicApp {
    g: egui_graphs::Graph,
}
Step 2: Implementing the new() function.
Next, implement the new() function for the BasicApp struct.
impl BasicApp {
    fn new(_: &eframe::CreationContext<'_>) -> Self {
        let g = generate_graph();
        Self { g: egui_graphs::Graph::from(&g) }
    }
}
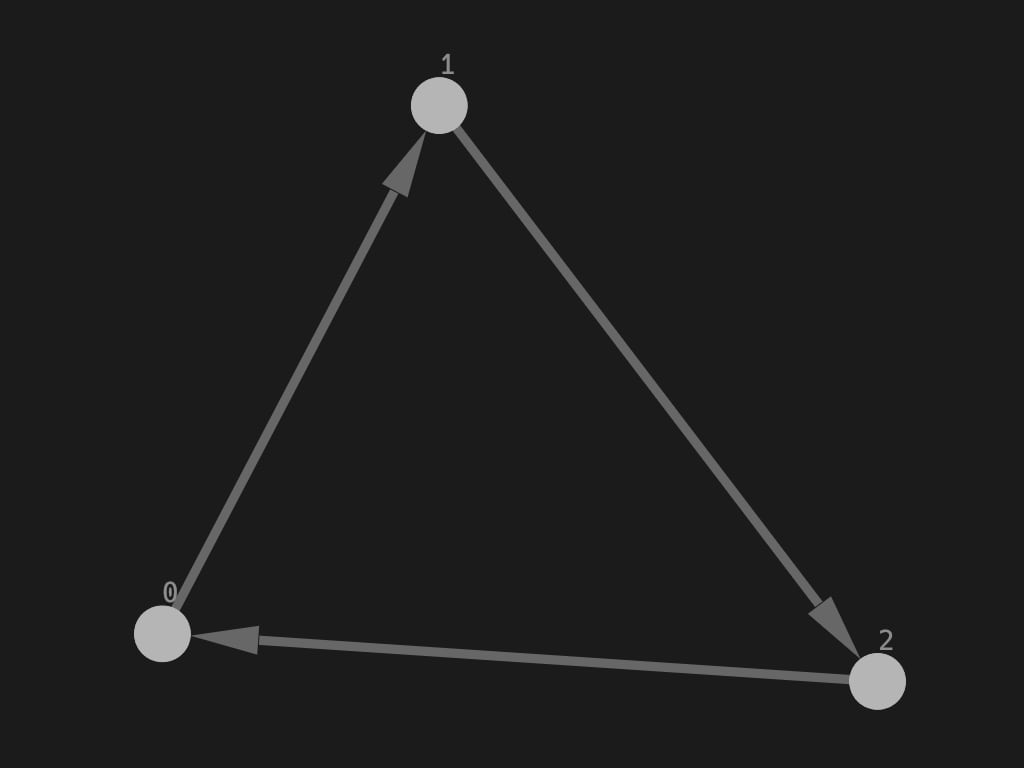
Step 3: Generating the graph.
Create a helper function called generate_graph(). In this example, we create three nodes and three edges.
fn generate_graph() -> petgraph::StableGraph<(), ()> {
    let mut g = petgraph::StableGraph::new();

    let a = g.add_node(());
    let b = g.add_node(());
    let c = g.add_node(());

    g.add_edge(a, b, ());
    g.add_edge(b, c, ());
    g.add_edge(c, a, ());

    g
}
Step 4: Implementing the eframe::App trait.
Now, lets implement the eframe::App trait for the BasicApp. In the update() function, we create a egui::CentralPanel and add the egui_graphs::GraphView widget to it.
impl eframe::App for BasicApp {
    fn update(&mut self, ctx: &egui::Context, _: &mut eframe::Frame) {
        egui::CentralPanel::default().show(ctx, |ui| {
            ui.add(&mut egui_graphs::GraphView::new(&mut self.g));
        });
    }
}
Step 5: Running the application.
Finally, run the application using the eframe::run_native() function.
fn main() {
    eframe::run_native(
        "egui_graphs_basic_demo",
        eframe::NativeOptions::default(),
        Box::new(|cc| Ok(Box::new(BasicApp::new(cc)))),
    )
    .unwrap();
}
Features
Events
Can be enabled with events feature. Events describe a change made in graph whether it changed zoom level or node dragging.
Combining this feature with custom node draw function allows to implement custom node behavior and drawing according to the events happening.
Dependencies
~8–14MB
~160K SLoC