2 releases
| 0.2.1 | Dec 3, 2020 |
|---|---|
| 0.2.0 | Dec 3, 2020 |
#357 in Visualization
530KB
344 lines
Viewercloud
Viewercloud is a library and also a cli to read and display Pointcloud.
It was initially used to display KITTI pointcloud.
However it was also tested on the Lyft Level 5 Dataset pointcloud.
It will also be able to display the 3D annotations and the 3D BoundingBox computed by your favorite algorithm.
Viewercloud will open a openGL window to display the pointcloud. Press qto close.
It can also take a screen shot of the current view to save as png. Press s take screenshot.
Python Usage
You can install pyviewercloud the python bindings to viewercloud thanks to Pyo3 and Pyo3-numpy
poetry add pyviewercloud
pip install pyviewercloud
import numpy as np
import pyviewercloud as pyviewer
# Create a new viewer with a window size 1200x1800.
viewer = pyviewer.PointcloudViewer(1200, 1800, 15000)
# Load some pointcloud from the lyft perception dataset
# Currently only support pointcloud as numpy.ndarray Nx3 in np.float32
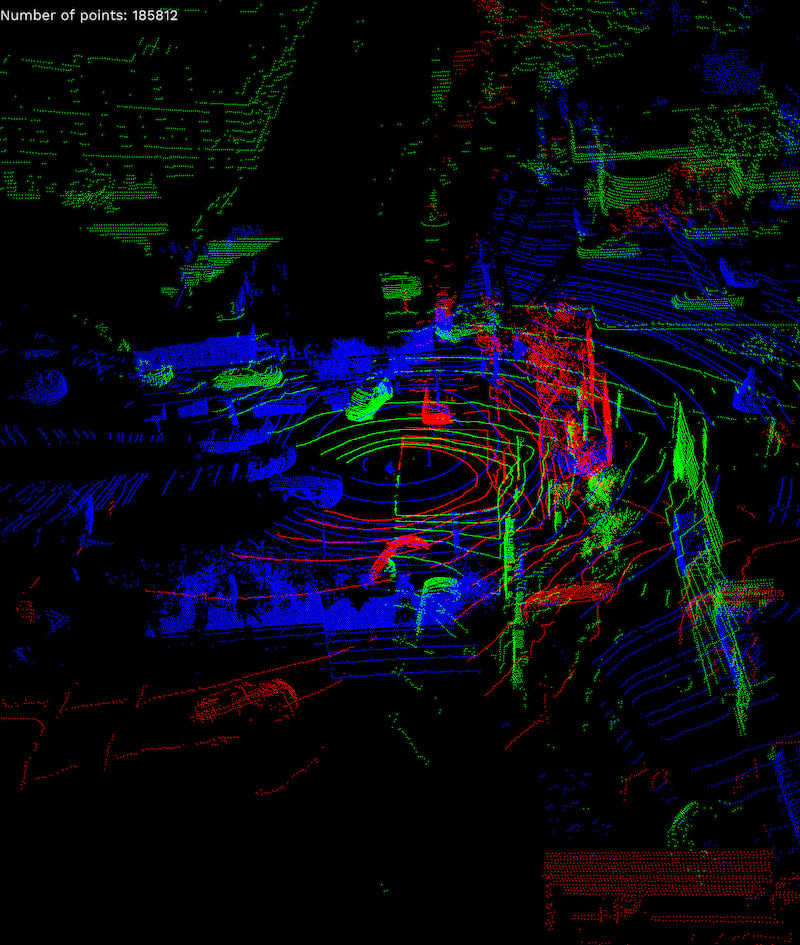
lyft_point_cloud_1 = np.fromfile("tests/data/lyft/host-a101_lidar0_1241893239502712366.bin", dtype=np.float32).reshape((-1, 5))[:,:3]
lyft_point_cloud_2= np.fromfile("tests/data/lyft/host-a101_lidar1_1241893239502712366.bin", dtype=np.float32).reshape((-1, 5))[:,:3]
lyft_point_cloud_3= np.fromfile("tests/data/lyft/host-a101_lidar2_1241893239502712366.bin", dtype=np.float32).reshape((-1, 5))[:,:3]
# Add them one by one to the viewer to have different color
viewer.add_pointcloud(lyft_point_cloud_1, [255, 0, 0])
viewer.add_pointcloud(lyft_point_cloud_2, [0, 0, 255])
viewer.add_pointcloud(lyft_point_cloud_3, [0, 255, 0])
# You can now display the window
viewer.show()
import numpy as np
import pyviewercloud as pyviewer
# Create a new viewer with a window size 1200x1800.
viewer = pyviewer.PointcloudViewer(1200, 1800, 15000)
# Load some pointcloud from the kitti dataset
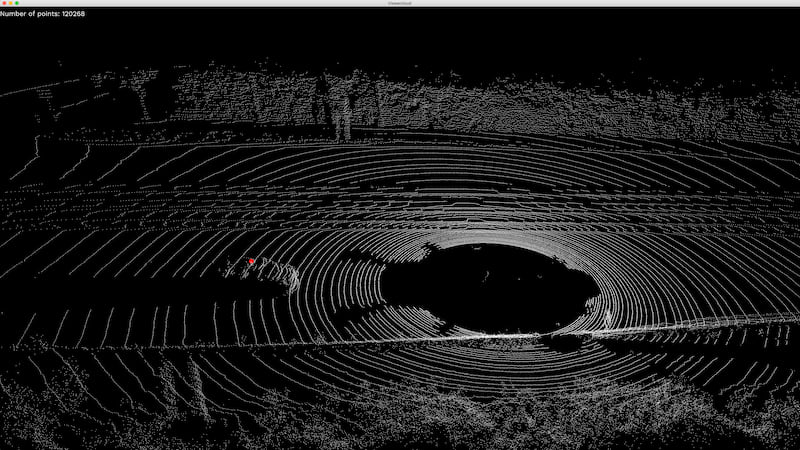
kitti_point_cloud = np.fromfile("tests/data/kitti/velodyne/000001.bin", dtype=np.float32).reshape((-1, 4))[:,:3]
viewer.add_pointcloud(kitti_point_cloud, [255, 255, 255])
# Add some centroids to have the same color.
# Currently only support centroids as numpy.ndarray Nx3 in np.float32
centroids = np.array([[-11.5,0,-0.8]]).astype(np.float32)
viewer.add_centroid(centroids, [255, 0, 0])
viewer.show()
CLI Usage
> viewercloud --help
viewercloud 0.2.1
Thomaub <github.thomaub@gmail.com>
Display KITTI 3D Pointcloud with annotations and your model inferences

USAGE:
    viewercloud <pointcloud-file> [ARGS]

ARGS:
    <pointcloud-file>     Path to the kitti Pointcloud .bin or .txt file
    <annotations-file>    Path to the kitti 3D annotation .txt file
    <inferences-file>     Path to your model inferences .json file

FLAGS:
    -h, --help       Prints help information
    -V, --version    Prints version information
Build
cargo build --release
It will be possible to download from github release and brew.
Dependencies
~16–27MB
~390K SLoC