3 releases (breaking)
| 0.4.0 | Jul 8, 2023 |
|---|---|
| 0.3.0 | Jul 2, 2023 |
| 0.2.3 | Apr 22, 2023 |
| 0.2.1 |
|
| 0.1.1 |
|
#418 in Visualization
170KB
4K
SLoC
You can find poloto on github and crates.io.
Timestamp Example
use poloto::build;
use poloto_chrono::UnixTime;
fn main() {
let timezone = &chrono::Utc;
use chrono::TimeZone;
//Source https://en.wikipedia.org/wiki/Men%27s_long_jump_world_record_progression
let data = [
(7.61, "05 August 1901"),
(7.69, "23 July 1921"),
(7.76, "07 July 1924"),
(7.89, "13 June 1925"),
(7.90, "07 July 1928"),
(7.93, "09 September 1928"),
(7.98, "27 October 1931"),
(8.13, "25 May 1935"),
(8.21, "12 August 1960"),
(8.24, "27 May 1961"),
(8.28, "16 July 1961"),
(8.31, "10 June 1962"),
(8.33, "25 May 1963"),
(8.34, "12 September 1964"),
(8.35, "29 May 1965"),
(8.35, "19 October 1967"),
(8.90, "18 October 1968"),
(8.95, "30 August 1991"),
];
let data = data.map(|(x, y)| {
let d = timezone.from_utc_datetime(
&chrono::NaiveDate::parse_from_str(y, "%d %B %Y")
.unwrap()
.and_hms_opt(0, 0, 0)
.unwrap(),
);
(UnixTime::from(d), x)
});
let plots = poloto::plots!(build::plot("").line(data), build::markers([], [0.0]));
poloto::frame_build()
.data(plots)
.build_and_label((
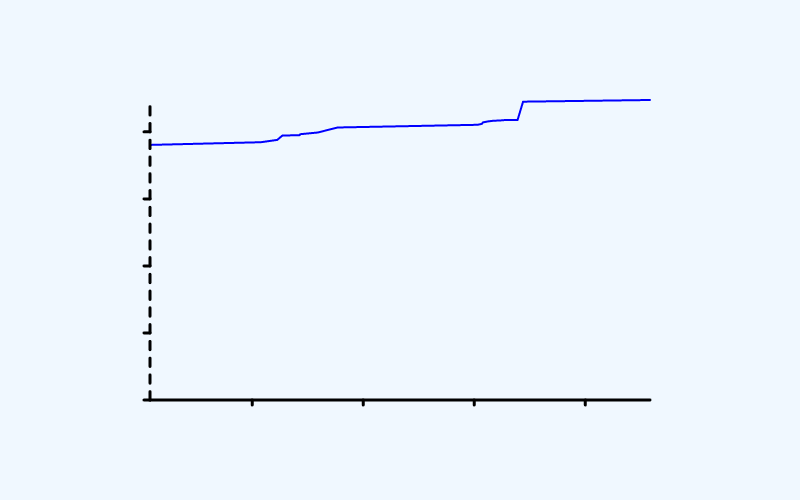
"Long Jump world record progression",
"Date",
"Mark (in meters)",
))
.append_to(poloto::header().light_theme())
.render_stdout();
}
Output
Dependencies
~1MB
~19K SLoC