32 releases
| 0.11.0-beta.17 | Dec 18, 2023 |
|---|---|
| 0.11.0-beta.15 | Nov 14, 2023 |
| 0.11.0-beta.12 | May 24, 2022 |
| 0.11.0-beta.10 | Mar 19, 2022 |
| 0.10.7 | Jul 23, 2019 |
#2386 in Command line utilities
1.5MB
4K
SLoC
Contains (WOFF font, 105KB) front-end/fonts/fa-solid-900.woff, (WOFF font, 79KB) front-end/fonts/fa-solid-900.woff2, (WOFF font, 51KB) front-end/fonts/RobotoMono-Bold.woff2, (WOFF font, 53KB) front-end/fonts/RobotoMono-Light.woff2, (WOFF font, 51KB) front-end/fonts/RobotoMono-Medium.woff2, (WOFF font, 51KB) front-end/fonts/RobotoMono-Regular.woff2
M Prober
![]()
This program aims to collect Linux system information including hostname, kernel version, uptime, RTC time, load average, CPU, memory, network interfaces, block devices and processes. It can be used not only as a normal CLI tool, but also a web application with a front-end webpage and useful HTTP APIs.
Help
EXAMPLES:
mprober hostname # Show the hostname
mprober kernel # Show the kernel version
mprober uptime # Show the uptime
mprober uptime -m # Show the uptime and refresh every second
mprober uptime -p # Show the uptime without colors
mprober uptime -l # Show the uptime with darker colors (fitting in with light themes)
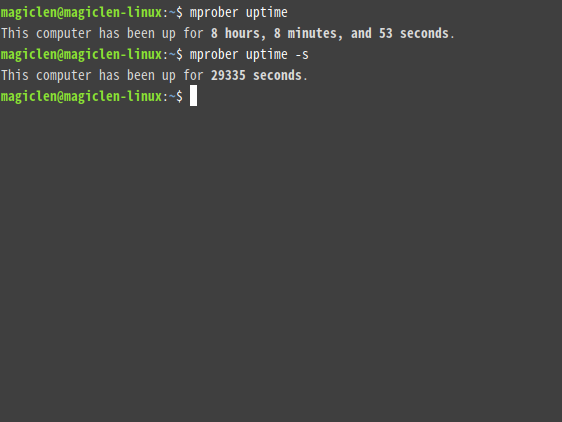
mprober uptime -s # Show the uptime in seconds
mprober time # Show the RTC (UTC) date and time
mprober time -m # Show the RTC (UTC) date and time and refresh every second
mprober time -p # Show the RTC (UTC) date and time without colors
mprober time -l # Show the RTC (UTC) date and time with darker colors (fitting in with light themes)
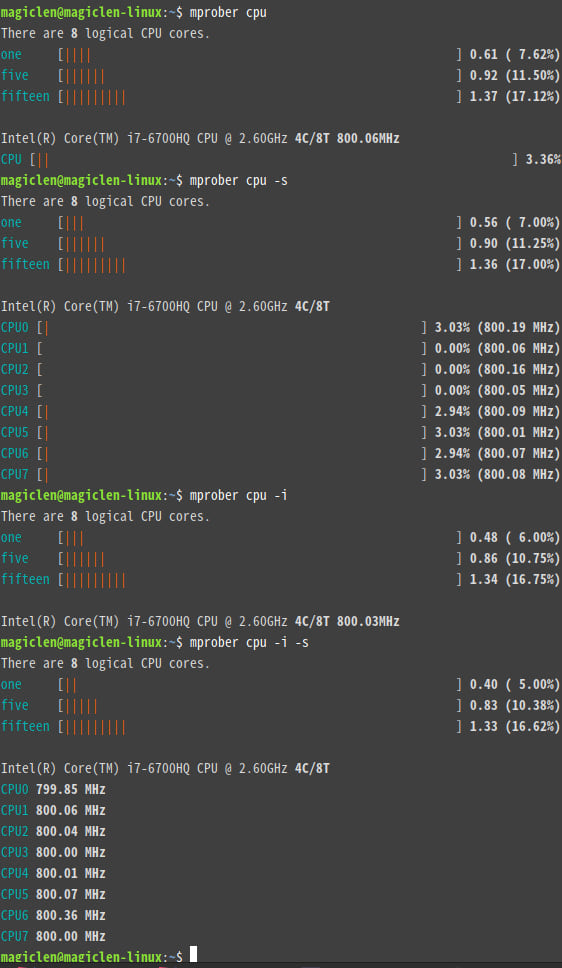
mprober cpu # Show load average and current CPU stats on average
mprober cpu -m 1000 # Show load average and CPU stats on average and refresh every 1000 milliseconds
mprober cpu -p # Show load average and current CPU stats on average without colors
mprober cpu -l # Show load average and current CPU stats on average with darker colors (fitting in with light themes)
mprober cpu -s # Show load average and current stats of CPU cores separately
mprober cpu -i # Only show CPU information
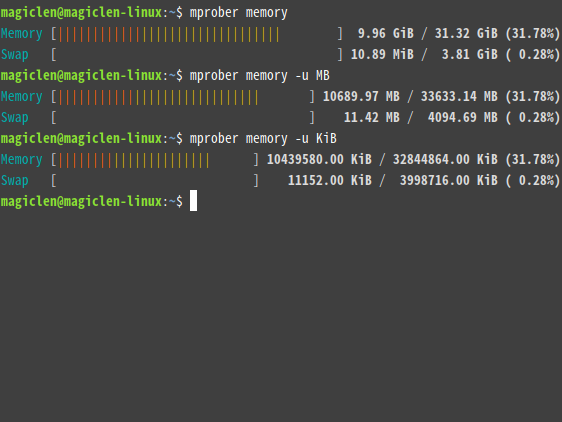
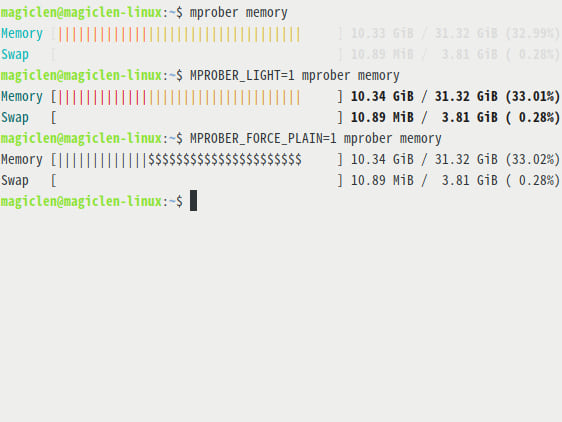
mprober memory # Show current memory stats
mprober memory -m 1000 # Show memory stats and refresh every 1000 milliseconds
mprober memory -p # Show current memory stats without colors
mprober memory -l # Show current memory stats with darker colors (fitting in with light themes)
mprober memory -u kb # Show current memory stats in KB
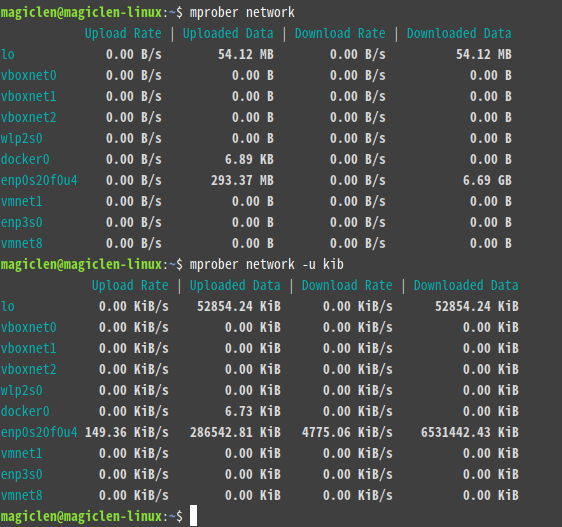
mprober network # Show current network stats
mprober network -m 1000 # Show network stats and refresh every 1000 milliseconds
mprober network -p # Show current network stats without colors
mprober network -l # Show current network stats with darker colors (fitting in with light themes)
mprober network -u kb # Show current network stats in KB
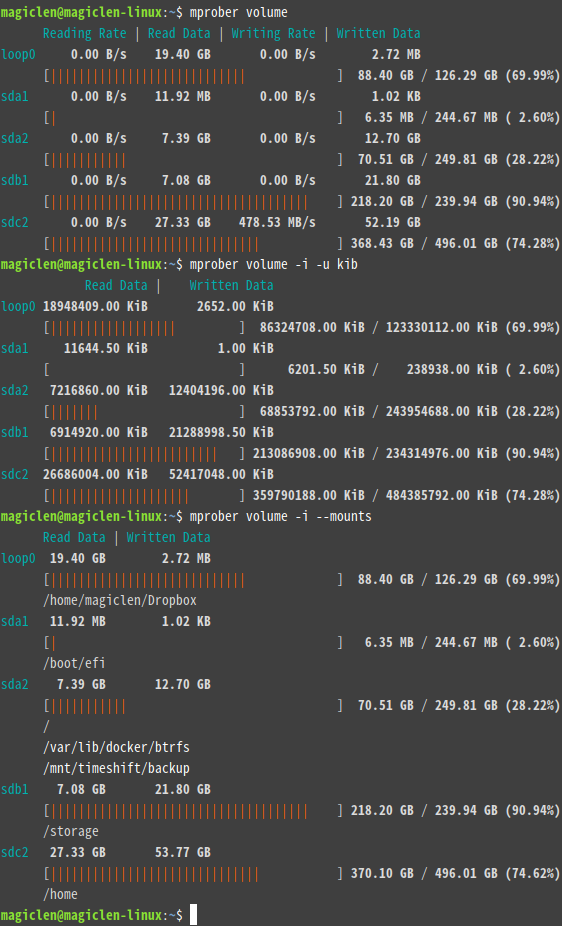
mprober volume # Show current volume stats
mprober volume -m 1000 # Show current volume stats and refresh every 1000 milliseconds
mprober volume -p # Show current volume stats without colors
mprober volume -l # Show current volume stats without colors
mprober volume -u kb # Show current volume stats in KB
mprober volume -i # Only show volume information without I/O rates
mprober volume --mounts # Show current volume stats including mount points
mprober process # Show a snapshot of the current processes
mprober process -m 1000 # Show a snapshot of the current processes and refresh every 1000 milliseconds
mprober process -p # Show a snapshot of the current processes without colors
mprober process -l # Show a snapshot of the current processes with darker colors (fitting in with light themes)
mprober process -i # Show a snapshot of the current processes but not including CPU usage
mprober process -u kb # Show a snapshot of the current processes. Information about memory size is in KB
mprober process --truncate 10 # Show a snapshot of the current processes with a specific truncation length to truncate user, group, program's names
mprober process --top 10 # Show a snapshot of current top-10 (ordered by CPU and memory usage) processes
mprober process -t # Show a snapshot of the current processes with the start time of each process
mprober process --pid-filter 3456 # Show a snapshot of the current processes which are related to a specific PID
mprober process --user-filter user1 # Show a snapshot of the current processes which are related to a specific user
mprober process --group-filter gp1 # Show a snapshot of the current processes which are related to a specific group
mprober process --tty-filter tty # Show a snapshot of the current processes which are related to specific tty names matched by a regex
mprober process --program-filter ab # Show a snapshot of the current processes which are related to specific program names or commands matched by a regex
mprober web # Start a HTTP service on port 8000 to monitor this computer. The default time interval is 3 seconds
mprober web -m 2 # Start a HTTP service on port 8000 to monitor this computer. The time interval is set to 2 seconds
mprober web -p 7777 # Start a HTTP service on port 7777 to monitor this computer
mprober web --addr 127.0.0.1 # Start a HTTP service on 127.0.0.1:8000 to monitor this computer
mprober web -a auth_key # Start a HTTP service on port 8000 to monitor this computer. APIs need to be invoked with an auth key
mprober web --only-api # Start a HTTP service on port 8000 to serve only HTTP APIs
mprober benchmark # Run benchmarks
mprober benchmark --disable-cpu # Run benchmarks except for benchmarking CPU
mprober benchmark --enable-memory # Benchmark the memory
Usage: mprober <COMMAND>
Commands:
hostname Show the hostname
kernel Show the kernel version
uptime Show the uptime
time Show the RTC (UTC) date and time
cpu Show CPU stats
memory Show memory stats
network Show network stats
volume Show volume stats
process Show process stats
web Start a HTTP service to monitor this computer
benchmark Run benchmarks to measure the performance of this environment
help Print this message or the help of the given subcommand(s)
Options:
-h, --help Print help
-V, --version Print version
Requirements
- Linux Kernel Version: 3.10+
Usage
Installation / Uninstallation
From crates.io,
cargo install mprober

# cargo uninstall mprober
From GitHub (x86 and x86_64),
(curl -s https://api.github.com/repos/magiclen/m-prober/releases/latest | sed -r -n 's/.*"browser_download_url": *"(.*\/mprober_'$(uname -m)')".*/\1/p' | wget -i -) && sudo mv mprober_$(uname -m) /usr/local/bin/mprober && sudo chmod +x /usr/local/bin/mprober

# sudo rm /usr/local/bin/mprober
CLI
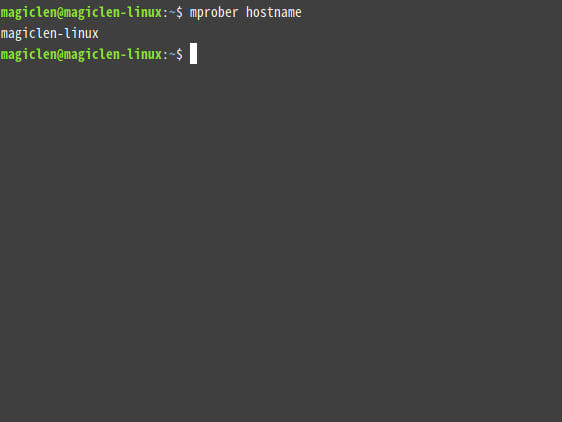
Get Hostname
mprober hostname
In addition to hostname, h, host, name, and servername are also acceptable.
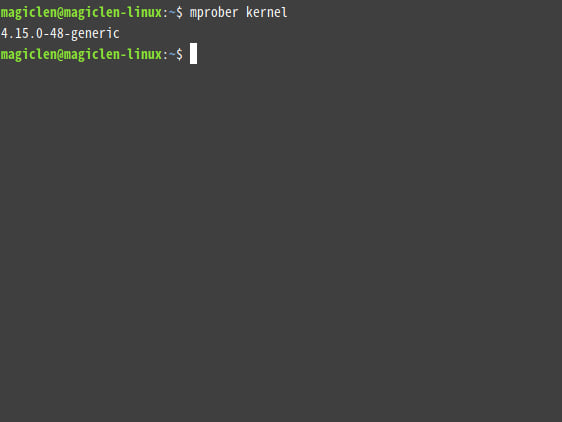
Get Kernel Version
mprober kernel
In addition to kernel, k, l, and linux are also acceptable.
Get System Uptime
mprober uptime
In addition to uptime, u, up, utime, and ut are also acceptable.
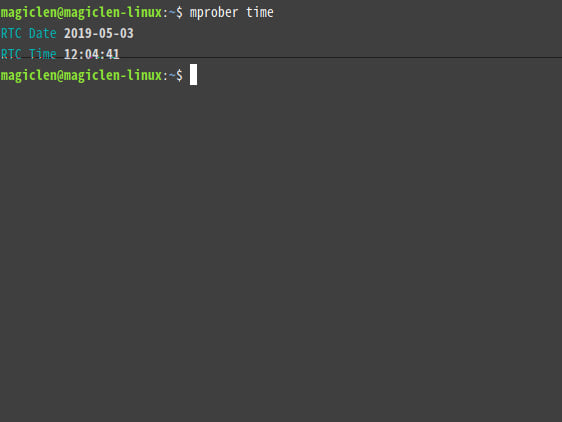
Get RTC Time
mprober time
In addition to time, t, systime, stime, st, utc, utctime, rtc, rtctime, and date are also acceptable.
Show CPU Stats
mprober cpu
In addition to cpu, c, cpus, core, cores, load, processor, and processors are also acceptable.
Show Memory Stats
mprober memory
In addition to memory, m, mem, f,free, memories, swap, ram, dram, ddr, cache, buffer, buffers, buf, and buff are also acceptable.
Show Network Stats
mprober network
In addition to network, n, net, networks,bandwidth, and traffic are also acceptable.
Show Volume Stats
mprober volume
In addition to volume, v, storage, volumes, d, disk, disks, blk, block, blocks, mount, mounts, ssd, and hdd are also acceptable.
Color Mode
Environment variables, MPROBER_LIGHT and MPROBER_FORCE_PLAIN can be used to control the output colors.
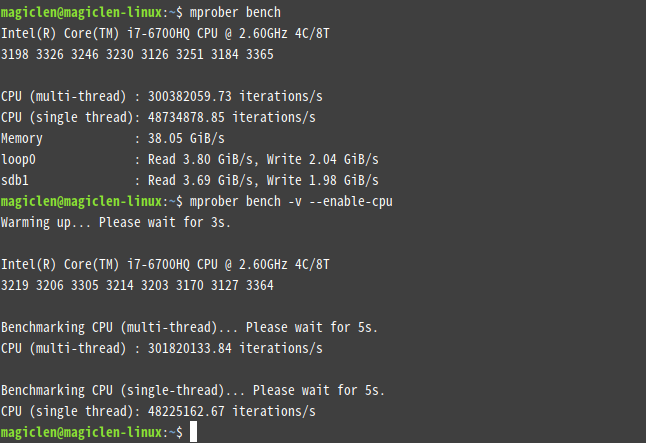
Benchmark
To benchmark the performance of CPU, memory and volumes,
mprober benchmark
In addition to benchmark, b, bench, and performance are also acceptable.
Adding the --disable-xxx or --enable-xxx flags can control what benchmarks you want to run.
Web (HTTP)
Launching the Server
mprober web
In addition to web, w, server, and http are also acceptable.
Once you start the server, you can open http://0.0.0.0:8000 via a web browser such as Firefox or Chrome.
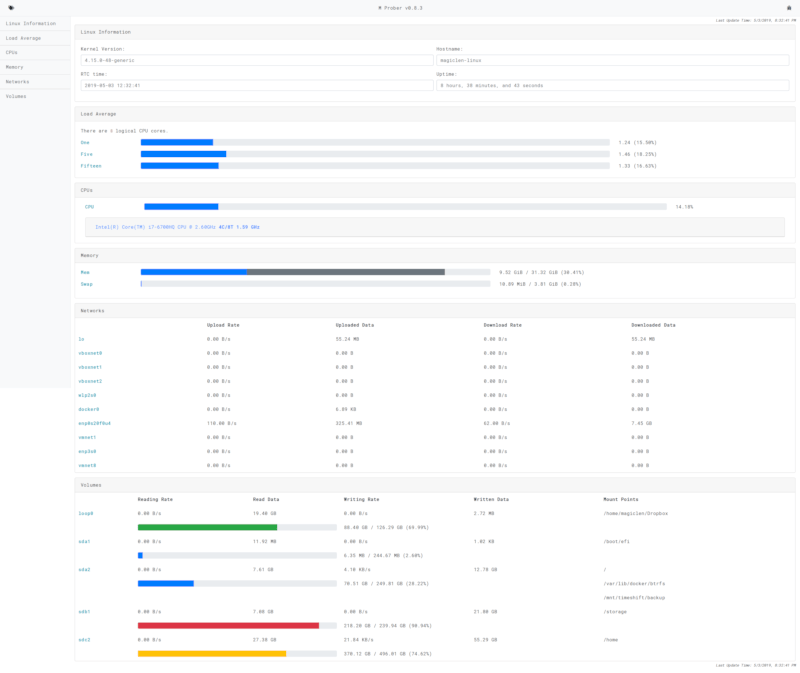
To change the listening port, use the -p <port> option. To change the detecting time interval, use the -m <SECONDS> option, where the <SECONDS> is ranged from 1 to 15.
HTTP APIs
GET /api/hostname
{
    "code": 0,
    "data": "magiclen-linux"
}
GET /api/kernel
{
    "code": 0,
    "data": "4.15.0-48-generic"
}
GET /api/uptime
{
    "code": 0,
    "data": 31694
}
The unit of data is seconds.
GET /api/time
{
    "code": 0,
    "data": {
        "date": "2019-05-03",
        "time": "12:43:14"
    }
}
It's RTC time.
GET /api/cpu
{
    "code": 0,
    "data": {
        "cpus": [
            {
                "cores": 4,
                "mhz": [
                    2571.96,
                    2688.208,
                    2604.095,
                    2700.238,
                    2700.034,
                    2699.908,
                    2700.329,
                    2699.986
                ],
                "model_name": "Intel(R) Core(TM) i7-6700HQ CPU @ 2.60GHz",
                "threads": 8
            }
        ],
        "load_average": {
            "fifteen": 1.02,
            "five": 0.83,
            "one": 0.61
        }
    }
}
GET /api/cpu-detect
{
    "code": 0,
    "data": {
        "cpus": [
            {
                "cores": 4,
                "mhz": [
                    1808.254,
                    1787.732,
                    1430.044,
                    1845.768,
                    1751.993,
                    1751.121,
                    1769.048,
                    1663.091
                ],
                "model_name": "Intel(R) Core(TM) i7-6700HQ CPU @ 2.60GHz",
                "threads": 8
            }
        ],
        "cpus_stat": [
            0.08386009270965024,
            0.09152542372881356,
            0.10472972972972971,
            0.11295681063122924,
            0.06418918918918919,
            0.09364548494983276,
            0.06397306397306397,
            0.053691275167785234,
            0.0821917808219178
        ],
        "load_average": {
            "fifteen": 1.02,
            "five": 0.84,
            "one": 0.74
        }
    }
}
The first value in the cpus_stat field is the average usage of each cores. The remaining values are the usage for each logical CPU core.
GET /api/memory
{
    "code": 0,
    "data": {
        "memory": {
            "available": 22659469312,
            "buffers": 10412032,
            "cache": 19094446080,
            "free": 4154060800,
            "shared": 119246848,
            "total": 33633140736,
            "used": 10374221824
        },
        "swap": {
            "cache": 385024,
            "free": 4082888704,
            "total": 4094685184,
            "used": 11411456
        }
    }
}
The unit of numbers is bytes.
GET /api/network-detect
{
    "code": 0,
    "data": [
        {
            "download_rate": 0.0,
            "download_total": 55713769,
            "interface": "lo",
            "upload_rate": 0.0,
            "upload_total": 55713769
        },
        {
            "download_rate": 702.0,
            "download_total": 7461474545,
            "interface": "enp0s20f0u4",
            "upload_rate": 1280.6666666666667,
            "upload_total": 331829069
        }
    ]
}
The unit of totals is bytes. The unit of rates is bytes/second.
GET /api/volume
{
    "code": 0,
    "data": [
        {
            "device": "sda2",
            "mount_points": [
                "/",
                "/var/lib/docker/btrfs"
            ],
            "read_total": 7612149760,
            "size": 249809600512,
            "used": 70506823680,
            "write_total": 12919939072
        },
        {
            "device": "sdb1",
            "mount_points": [
                "/storage"
            ],
            "read_total": 7080878080,
            "size": 239938535424,
            "used": 218200993792,
            "write_total": 21799934464
        },
        {
            "device": "sdc2",
            "mount_points": [
                "/home"
            ],
            "read_total": 27511930880,
            "size": 496011051008,
            "used": 370128474112,
            "write_total": 56615944192
        }
    ]
}
The unit of totals is bytes.
GET /api/volume-detect
{
    "code": 0,
    "data": [
        {
            "device": "sda2",
            "mount_points": [
                "/",
                "/var/lib/docker/btrfs"
            ],
            "read_rate": 0.0,
            "read_total": 7612149760,
            "size": 249809600512,
            "used": 70506823680,
            "write_rate": 0.0,
            "write_total": 12928978944
        },
        {
            "device": "sdb1",
            "mount_points": [
                "/storage"
            ],
            "read_rate": 0.0,
            "read_total": 7080878080,
            "size": 239938535424,
            "used": 218200993792,
            "write_rate": 0.0,
            "write_total": 21799934464
        },
        {
            "device": "sdc2",
            "mount_points": [
                "/home"
            ],
            "read_rate": 0.0,
            "read_total": 27511934976,
            "size": 496011051008,
            "used": 370131861504,
            "write_rate": 4965717.333333333,
            "write_total": 56771334144
        }
    ]
}
The unit of totals is bytes. The unit of rates is bytes/second.
GET /api/all
{
    "code": 0,
    "data": {
        "cpus": [
            {
                "cores": 4,
                "mhz": [
                    1200.121,
                    1200.272,
                    1200.12,
                    1200.055,
                    1200.098,
                    1200.034,
                    1200.014,
                    1200.124
                ],
                "model_name": "Intel(R) Core(TM) i7-6700HQ CPU @ 2.60GHz",
                "threads": 8
            }
        ],
        "cpus_stat": [
            0.04951741502308015,
            0.043333333333333335,
            0.030405405405405407,
            0.05743243243243243,
            0.056666666666666664,
            0.04983388704318937,
            0.05387205387205387,
            0.05405405405405406,
            0.05067567567567568
        ],
        "hostname": "magiclen-linux",
        "kernel": "4.15.0-48-generic",
        "load_average": {
            "fifteen": 0.8,
            "five": 0.53,
            "one": 0.28
        },
        "memory": {
            "available": 22578839552,
            "buffers": 10412032,
            "cache": 19104878592,
            "free": 4062957568,
            "shared": 119230464,
            "total": 33633140736,
            "used": 10454892544
        },
        "network": [
            {
                "download_rate": 0.0,
                "download_total": 55798721,
                "interface": "lo",
                "upload_rate": 0.0,
                "upload_total": 55798721
            },
            {
                "download_rate": 9.333333333333334,
                "download_total": 7463048290,
                "interface": "enp0s20f0u4",
                "upload_rate": 28.666666666666668,
                "upload_total": 333465932
            }
        ],
        "rtc_time": {
            "date": "2019-05-03",
            "time": "12:54:34"
        },
        "swap": {
            "cache": 385024,
            "free": 4082888704,
            "total": 4094685184,
            "used": 11411456
        },
        "uptime": 32437,
        "volumes": [
            {
                "device": "sda2",
                "mount_points": [
                    "/",
                    "/var/lib/docker/btrfs"
                ],
                "read_rate": 0.0,
                "read_total": 7612149760,
                "size": 249809600512,
                "used": 70506831872,
                "write_rate": 0.0,
                "write_total": 12939075584
            },
            {
                "device": "sdb1",
                "mount_points": [
                    "/storage"
                ],
                "read_rate": 0.0,
                "read_total": 7080878080,
                "size": 239938535424,
                "used": 218200993792,
                "write_rate": 0.0,
                "write_total": 21799934464
            },
            {
                "device": "sdc2",
                "mount_points": [
                    "/home"
                ],
                "read_rate": 0.0,
                "read_total": 27521441792,
                "size": 496011051008,
                "used": 370118373376,
                "write_rate": 744106.6666666666,
                "write_total": 56883159040
            }
        ]
    }
}
Authorization
If you need to expose above HTTP APIs to the Internet. In order to prevent these APIs from being invoked by anyone, you can enable a simple authorization mechanism that is built in this program.
When starting the HTTP server from CLI, you can add a -a <AUTH_KEY> option. Then, every API needs to be invoked by a request which contains a Authorization header to send the AUTH_KEY.
Also, you may want to disable the web page. Just add a --only-api flag.
TODO
- Process snapshot (HTTP, documentation)
- Database Detection
- Benchmark (networks)
License
Dependencies
~25–57MB
~1M SLoC