53 releases (30 breaking)
| 0.38.0 | Mar 16, 2025 |
|---|---|
| 0.37.0 | Feb 23, 2025 |
| 0.29.0 | Dec 22, 2024 |
| 0.25.0 | Nov 24, 2024 |
| 0.11.0 | Jul 19, 2020 |
#33 in Command line utilities
380KB
9K
SLoC
Oprs
![]()
![]()
Oprs is a process monitor for Linux. The name is an abbreviation for Observe Process ReSources.
It's based on procfs.
Features
- Monitor memory, execution time, input/output, page fault, file descriptors, mapped memory regions.
- Optional minimum and maximum.
- Select processes by PID, PID file or name.
- Display in plain text or a terminal UI.
- Export in CSV or RRDtool format.
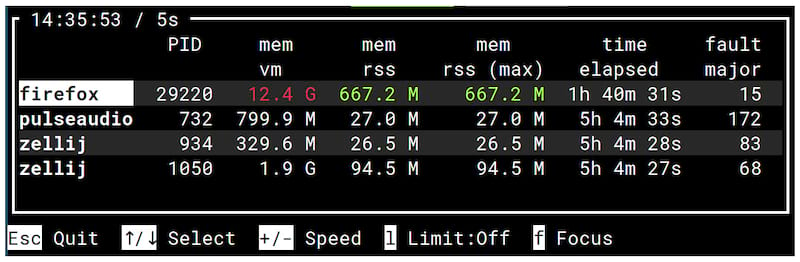
In a terminal, if no process is specified on the command line, all the visible processes are displayed in a tree in an interactive mode. See the help that is available in this mode.
Example
To get the memory size, elapsed time and page fault of a process by PID (firefox), a process by pid file (pulseaudio) and a process by name (bash), run:
oprs -F units -p 29220 -f pulseaudio.pid -n zellij mem:vm mem:rss+max time:elapsed fault:major
Metrics
Use option --list to print the list of available metrics.
Limited patterns are allowed for metrics: by prefix mem:*, suffix *:call,
both io:*:count.
A metric may be followed by a unit, for example: mem:vm/gi. It's usually
easier to use --format units.
Available units:
- ki: kibi
- mi: mebi
- gi: gibi
- ti: tebi
- k: kilo
- m: mega
- g: giga
- t: tera
- sz: the best unit in k, m, g or t.
- du: format duration as hour, minutes, seconds.
Metrics can be also aggregated using +min and/or +max. For example mem:vm+max/gi
prints the virtual memory size and the peak size. To get only the max,
use -raw as in mem:vm-raw+max. To get the current value, the min and the max,
use mem:vm+min+max.
For some metrics, min or max is meaningless.
For CPU and the system and user time of a process, there is also the aggregated
ratio over the entire system. Print the CPU usage with time:cpu-raw+ratio.
The default metrics are the CPU usage, the VM size and the elapsed time.
Data type
Metrics are either:
- Counters: values that always increase like the number of read call or the CPU time.
- Gauges: positive values that may decrease such as the memory comsumption.
CPU usage
Unlike other tools, the CPU usage of a process displayed by time:cpu+ratio is
the percentage of the total CPU time. A process using all cores of a 4-cores
system would be at 100%, not 400%.
The CPU usage is
(stime + utime) / ((user - guest) + (nice - guest_nice) + system + idle + iowait + irq + softirq)
where stime and utime comes from /proc/PID/stat and user, … from /proc/stat.
Processes
Processes are selected using one of the four following options:
-
Option
--pid: the pid of the process. -
Option
--pid-file: file containing the pid of the process. It doesn't have to exists when the command starts. -
Option
--name: monitor all processes with the given name.
These options can be specified more than once.
Export
CSV
In CSV export, the first column is the number of seconds since the Unix Epoch.
The size of exported data can be limited with --export-size to set the maximum
size of a CSV file and --export-count to set the maximum number of files.
Round Robin Database (RRD)
Creates one RRD database for each process by spawning a RRDtool command. Only raw values are written in the database.
The number of rows is set with option --export-count.
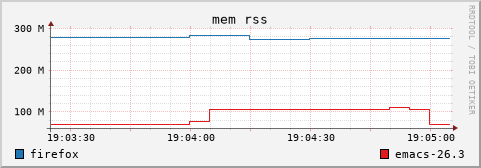
Option --graph creates one png file per metric in the export directory.
Configuration
Configuration file name is settings.ini. It's located according to
the XDG Base Directory Specification.
Example ~/.config/oprs/settings.ini:
[display]
mode = term
every = 10
format = units
theme = light
border = yes

[export]
kind = csv
dir = /tmp
size = 10m
count = 5

[logging]
file = /var/log/oprs.log
level = info

[targets]
system = yes
myself = yes
License
Copyright (c) 2020-2025 Laurent Pelecq
oprs is distributed under the terms of the GNU General Public License version 3.
See the LICENSE GPL3 for details.
Dependencies
~14–25MB
~379K SLoC