1 unstable release
| 0.1.0 | Sep 23, 2024 |
|---|
#162 in Visualization
62KB
1.5K
SLoC
magpies
A command-line tool for polling and visualizing JSON-formatted time series metrics.
This tool does not require any schema definitions, making it ideal for quickly understanding an overview of JSON-formatted time series metrics.
For more detailed or complex analysis, it is recommended to use more feature-rich tools such as Prometheus and Grafana.
Examples
// Install.
$ cargo install magpies

// Print help.
$ magpies -h
Command-line tool for polling and visualizing JSON-formatted time series metrics

Usage: magpies <COMMAND>

Commands:
  poll    Poll the metrics of the specified targets and output the results in JSON Lines format to stdout
  view    Launch the TUI viewer to visualize the results of the `poll` command
  target  Generate a JSON object that defines a polling target
  help    Print this message or the help of the given subcommand(s)

Options:
  -h, --help     Print help
  -V, --version  Print version

// Collect memory metrics via sysinfojson command.
$ cargo install sysinfojson
$ sysinfojson system memory | jq .
{
  "memory": {
    "available_memory": 38591873024,
    "total_memory": 68719476736,
    "total_swap": 0,
    "used_memory": 32941457408,
    "used_swap": 0
  }
}

$ LOCAL_TARGET=$(magpies target --name local -- sysinfojson system memory)
$ REMOTE_TARGET=$(magpies target --name remote -- ssh foo@bar sysinfojson system memory)

$ magpies poll $LOCAL_TARGET $REMOTE_TARGET | tee metrics.jsonl
{"target":"local","timestamp":1727066396.667561,"metrics":{"memory":{"available_memory":38727598080,"total_memory":68719476736,"total_swap":0,"used_memory":32796721152,"used_swap":0}}}
{"target":"remote","timestamp":1727066397.19239,"metrics":{"memory":{"available_memory":3853799424,"total_memory":11564953600,"total_swap":8589930496,"used_memory":7711154176,"used_swap":2966417408}}}
{"target":"local","timestamp":1727066397.68037,"metrics":{"memory":{"available_memory":38723633152,"total_memory":68719476736,"total_swap":0,"used_memory":32799850496,"used_swap":0}}}
{"target":"remote","timestamp":1727066398.052064,"metrics":{"memory":{"available_memory":3853238272,"total_memory":11564953600,"total_swap":8589930496,"used_memory":7711715328,"used_swap":2966417408}}}
...

// Launch the TUI viewer in a separate terminal.
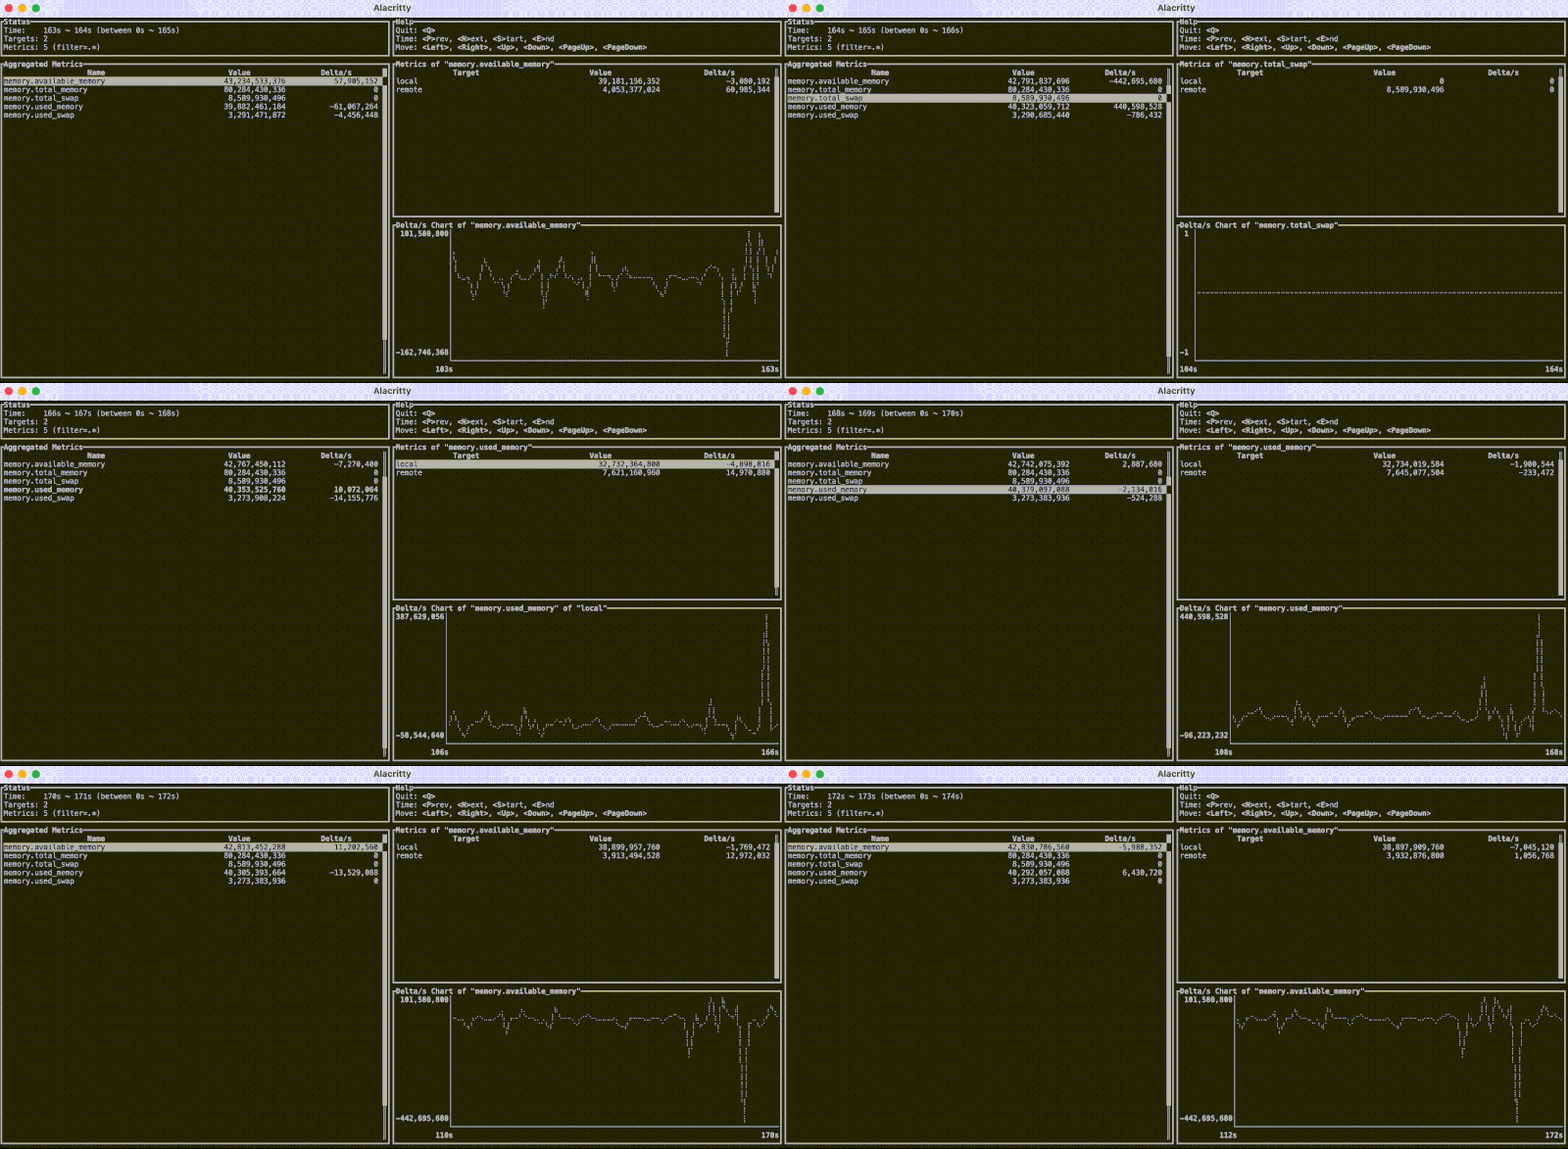
$ magpies view metrics.jsonl --interval 5 --portable-chart
┏Status━━━━━━━━━━━━━━━━━━━━━━━━━━━━━━━━━━━━━━━━━━━━━━━━━━━━┓┏Help━━━━━━━━━━━━━━━━━━━━━━━━━━━━━━━━━━━━━━━━━━━━━━━━━━━━━┓
┃Time:    120s ~ 124s (between 0s ~ 124s)                  ┃┃Quit: <Q>                                                ┃
┃Targets: 2                                                ┃┃Time: <P>rev, <N>ext, <S>tart, <E>nd                     ┃
┃Metrics: 5 (filter=.*)                                    ┃┃Move: <Left>, <Right>, <Up>, <Down>, <PageUp>, <PageDown>┃
┗━━━━━━━━━━━━━━━━━━━━━━━━━━━━━━━━━━━━━━━━━━━━━━━━━━━━━━━━━━┛┗━━━━━━━━━━━━━━━━━━━━━━━━━━━━━━━━━━━━━━━━━━━━━━━━━━━━━━━━━┛
┏Aggregated Metrics━━━━━━━━━━━━━━━━━━━━━━━━━━━━━━━━━━━━━━━━┓┏Metrics of "memory.used_memory"━━━━━━━━━━━━━━━━━━━━━━━━━━┓
┃           Name                  Value         Delta/s   ║┃┃       Target               Value            Delta/s    █┃
┃memory.available_memory      42,546,443,605     -353,293 ║┃┃local                    32,797,085,696        -747,601 █┃
┃memory.total_memory          80,284,430,336            0 █┃┃remote                    7,746,992,810       1,172,493 █┃
┃memory.total_swap             8,589,930,496            0 █┃┃                                                        █┃
┃memory.used_memory           40,544,078,506      424,891 █┃┃                                                        █┃
┃memory.used_swap              2,955,407,360            0 █┃┃                                                        █┃
┃                                                         █┃┃                                                        ║┃
┃                                                         █┃┗━━━━━━━━━━━━━━━━━━━━━━━━━━━━━━━━━━━━━━━━━━━━━━━━━━━━━━━━━┛
┃                                                         █┃┏Delta/s Chart of "memory.used_memory"━━━━━━━━━━━━━━━━━━━━┓
┃                                                         █┃┃ 2,629,345│   •••    ••      ••      •••           ••••  ┃
┃                                                         █┃┃          │  •   ••••  •    •  ••  ••   ••      •••    ••┃
┃                                                         █┃┃          │ •           •   •    ••       ••  ••         ┃
┃                                                         █┃┃          │•             • •                ••           ┃
┃                                                         █┃┃-3,064,996│               •                              ┃
┃                                                         █┃┃          └──────────────────────────────────────────────┃
┃                                                         ║┃┃        60s                                          120s┃
┗━━━━━━━━━━━━━━━━━━━━━━━━━━━━━━━━━━━━━━━━━━━━━━━━━━━━━━━━━━┛┗━━━━━━━━━━━━━━━━━━━━━━━━━━━━━━━━━━━━━━━━━━━━━━━━━━━━━━━━━┛
Viewer Terms
Aggregated Metricstable:Namecolumn:- The name of the metric.
Valuecolumn:- The aggregated value of the metric.
- For numeric metrics, the sum of the metric values of the targets is displayed.
- For non-numeric metrics, the union of the metric values of the targets is displayed.
Delta/scolumn:- If the metric is numeric,
({{ CURRENT_VALUE }} - {{ PREVIOUS_VALUE }}) / {{ INTERVAL_SECONDS }}is displayed.
- If the metric is numeric,
Metrics of "{{ METRIC_NAME }}"table:Targetcolumn:- The target name.
Valuecolumn:- The metric value of the target.
- If multiple values are collected within the same interval:
- For numeric metrics, the average of the values is displayed.
- For non-numeric metrics, the union of the values is displayed.
Delta/scolumn:- If the metric is numeric,
({{ CURRENT_VALUE }} - {{ PREVIOUS_VALUE }}) / {{ INTERVAL_SECONDS }}is displayed.
- If the metric is numeric,
Dependencies
~10–21MB
~311K SLoC
