4 releases
| 0.2.1 | Nov 9, 2021 |
|---|---|
| 0.2.0 | Nov 8, 2021 |
| 0.1.1 | Nov 8, 2021 |
| 0.1.0 | Nov 8, 2021 |
#670 in Debugging
25 downloads per month
155KB
222 lines
Debug Plotter
This crate provides a convenient macro to quickly plot variables.
Example
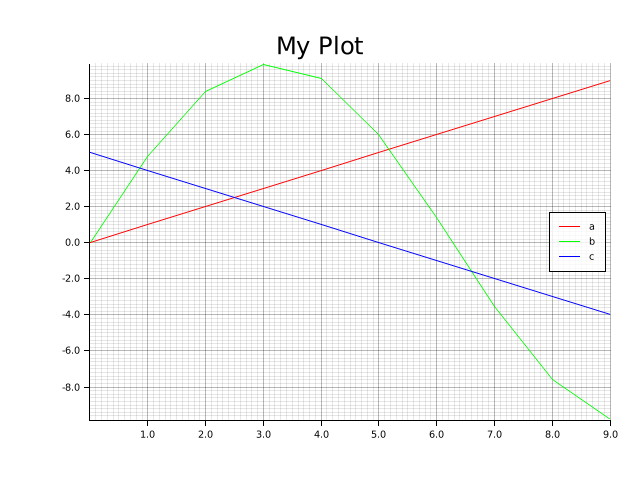
In this example, we quickly want to plot the variables a, b, and c.
Optionally, we can name the plot. Plots are saved as a PNG image in the
plots directory that is created in the working directory.
fn main() {
    for a in 0usize..10usize {
        let b = (a as f32 / 2.0).sin() * 10.0;
        let c = 5 - (a as i32);

        debug_plotter::plot!(a, b, c where caption = "My Plot");
    }
}
The example above generates a plot named "My Plot" and saves it to 'plots/My_Plot.png`.
Documentation
For more information on how to use this crate, please take a look at the documentation or the examples.
Debug and Release Mode
Variables are only plotted if your code is run in debug mode.
In release mode, plot! macros are ignored.
If you want to avoid compiling the dependencies for this crate in release mode, add --no-default-features.
If you want to plot variables in release mode, use the feature plot-release.
Dependencies
~0–2.3MB
~41K SLoC