1 unstable release
Uses old Rust 2015
| 0.0.9 | Feb 15, 2018 |
|---|
#233 in Visualization
26 downloads per month
225KB
2K
SLoC
Astrup
A rust plotting library using gtk-rs as a backend. This is still very much a small hobby project. I believe it is ok for simple use, but lots of changes (also breaking ones) should be expected.
For alternative rust plotting libraries, see e.g.
Build:
- Install rust, and make sure
~/.cargo/bin/is in yourPATH. - Make sure you have GTK+, GLib, and Cairo development files on your system. Install instructions can be found here.
- Clone the repository, and build with
cargo build.
Gloals:
- Plot data from multiple containers (first priority:
Vecandndarray). - Building plots should be intuitive.
- Plots should look nice and informative.
- It should be very configurable.
Planned charts
The table below lists, by priority, the planned chart variants. Currently, only simple scatter and line plots are implemented.
| Variant | Implemented |
|---|---|
| Scatter | Partially |
| Line | Partially |
| Histogram | No |
| Matrix heatmap | No |
| Image | No |
| Filled curve | No |
| Box plot | No |
| Pie charts | No |
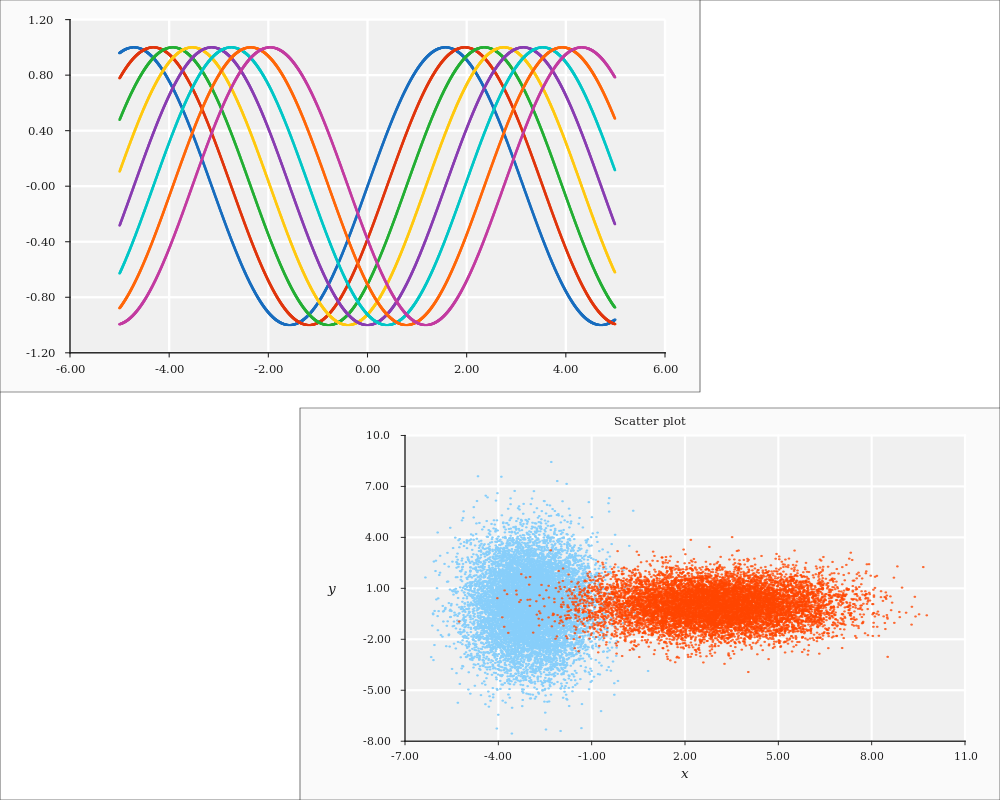
Example
extern crate ndarray;
extern crate rand;
extern crate astrup;

use std::f64::consts::PI;

use ndarray::Array;
use rand::distributions::{IndependentSample, Normal};
use rand::{thread_rng};

use astrup::view::View;
use astrup::figure::Figure;
use astrup::plot::Plot;
use astrup::chart::Chart;
use astrup::chart::scatter::Scatter;
use astrup::chart::line::Line;

fn main() {

    // Create data contained in ndarray
    let x_data = Array::from_iter((0..100).map(|x| (x as f64) * 2.0 * PI / 100.0));
    let y_data1 = Array::from_iter((0..100).map(|i| x_data[i].sin()));
    let y_data2 = Array::from_iter((0..100).map(|i| (x_data[i] - PI / 2.0).sin()));

    // Plot lines
    let line1 = Line::new(&x_data, &y_data1).set_stroke_style("dotted");
    let line2 = Line::new(&x_data, &y_data2).set_color_rgba(0.9, 0.2, 0.2, 0.9);

    // Add lines to a plot
    let line_plot = Plot::new().add(Chart::Line(line1))
                               .add(Chart::Line(line2))
                               .set_y_min(-1.2)
                               .set_local_frame(0.0, 0.7, 0.51, 1.0);

    // Create scatter points
    let normal_0_1 = Normal::new(0.0, 1.0);
    let normal_0_2 = Normal::new(0.0, 2.0);
    let x_data: Vec<f64> = (0..1000)
                           .map(|_| normal_0_1.ind_sample(&mut thread_rng()))
                           .collect();
    let y_data: Vec<f64> = (0..1000)
                           .map(|_| normal_0_2.ind_sample(&mut thread_rng()))
                           .collect();
    let scatter = Scatter::new(&x_data, &y_data).set_color_rgba(0.1, 0.8, 0.3, 0.9)
                                                .set_point_size(0.005);

    // Add scatter points to a new plot
    let scatter_plot = Plot::new().set_local_frame(0.3, 1.0, 0.0, 0.49)
                                  .add(Chart::Scatter(scatter));

    // Add the plots to a figure, and save it
    let fig = Figure::new().add(line_plot)
                           .add(scatter_plot)
                           .set_width(1000)
                           .set_height(800)
                           .set_border_thickness(0.001)
                           .save("assets/frontpage_example.png").expect("Could not save frontpage_example.png");

    // Display the result on screen
    View::new_from(fig).expect("Could not add figure to view")
                       .show();
}
Dependencies
~20MB
~450K SLoC