6 releases (breaking)
| 0.5.1 | Mar 28, 2020 |
|---|---|
| 0.5.0 | Mar 14, 2020 |
| 0.4.0 | Mar 2, 2019 |
| 0.3.0 | Mar 1, 2018 |
| 0.1.0 | Mar 9, 2017 |
#244 in Visualization
2,743 downloads per month
Used in fewer than 15 crates
105KB
2.5K
SLoC
plotlib
![]()
![]()
![]()
![]()
![]()
plotlib is a generic data visualisation and plotting library for Rust.
It is currently in the very early stages of development.
It can currently produce:
- histograms
- scatter plots
- line graphs from data or from function definitions
- box plots
- bar charts
rendering them as either SVG or plain text.
The API is still very much in flux and is subject to change.
For example, code like:
use plotlib::page::Page;
use plotlib::repr::Plot;
use plotlib::view::ContinuousView;
use plotlib::style::{PointMarker, PointStyle};
fn main() {
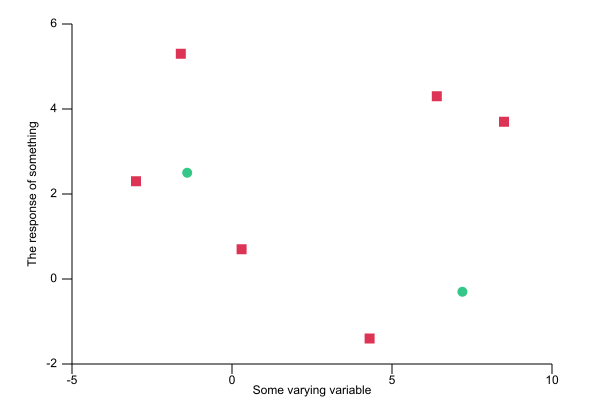
// Scatter plots expect a list of pairs
let data1 = vec![
(-3.0, 2.3),
(-1.6, 5.3),
(0.3, 0.7),
(4.3, -1.4),
(6.4, 4.3),
(8.5, 3.7),
];
// We create our scatter plot from the data
let s1: Plot = Plot::new(data1).point_style(
PointStyle::new()
.marker(PointMarker::Square) // setting the marker to be a square
.colour("#DD3355"),
); // and a custom colour
// We can plot multiple data sets in the same view
let data2 = vec![(-1.4, 2.5), (7.2, -0.3)];
let s2: Plot = Plot::new(data2).point_style(
PointStyle::new() // uses the default marker
.colour("#35C788"),
); // and a different colour
// The 'view' describes what set of data is drawn
let v = ContinuousView::new()
.add(s1)
.add(s2)
.x_range(-5., 10.)
.y_range(-2., 6.)
.x_label("Some varying variable")
.y_label("The response of something");
// A page with a single view is then saved to an SVG file
Page::single(&v).save("scatter.svg").unwrap();
}
will produce output like:
Dependencies
~150KB