5 releases
| 0.1.4 | Mar 10, 2025 |
|---|---|
| 0.1.3 | Mar 4, 2025 |
| 0.1.2 | Jan 29, 2024 |
| 0.1.1 | Jan 25, 2024 |
| 0.1.0 | Jan 25, 2024 |
#12 in Emulators
2MB
14K
SLoC
Trapezoid
![]()
![]()
trapezoid is a PSX/PS1 emulator built from scratch using Rust.
This is a personal project for fun and to experience emulating hardware and connecting them together.
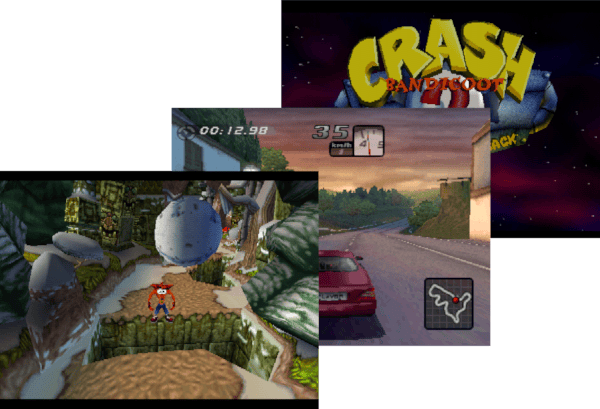
Showcase
Building and installation
Installing
You can install trapezoid from crates.io using cargo:
cargo install trapezoid
Building
If you want to experience the latest development version, you can build trapezoid yourself.
cargo build --release
The emulator will be slow without optimization, that's why we have
opt-level = 2indebugprofile.
Emulator core
The emulator core is implemented as a library in trapezoid-core, this library is the emulator core, and contain
all the components. You can easily take the core and build a frontend around it, or use it as a server.
Check the trapezoid-core for more info and documentation.
Frontend
Controls
The Frontend implementations has its own controls mapping, this can be configured
if you decide to use trapezoid-core directly
Keyboard
| keyboard | PSX controller |
|---|---|
| Enter | Start |
| Backspace | Select |
| Num1 | L1 |
| Num2 | L2 |
| Num3 | L3 |
| Num0 | R1 |
| Num9 | R2 |
| Num8 | R3 |
| W | Up |
| S | Down |
| D | Right |
| A | Left |
| I | Triangle |
| K | X |
| L | Circle |
| J | Square |
Debugging
trapezoid has a built-in powerfull debugger to help debug games and access to data.
Check DEBUGGER.md for more information.
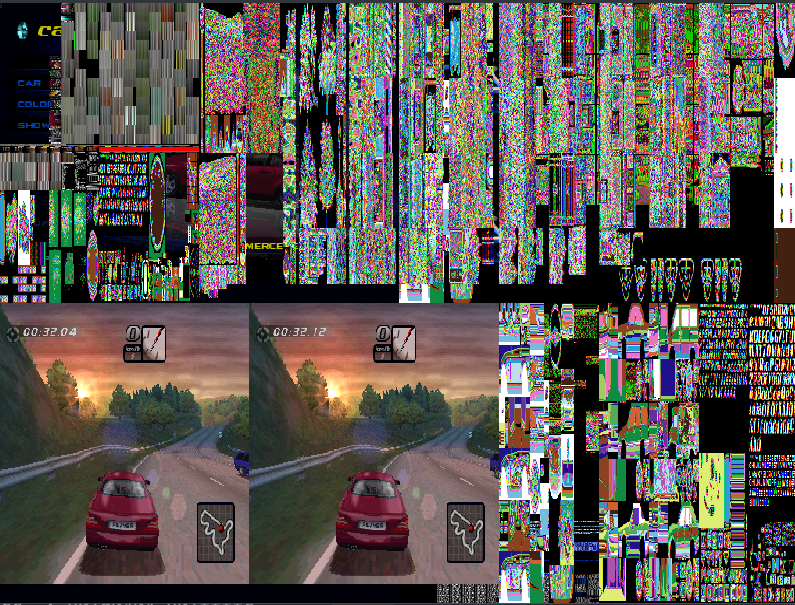
VRAM
We can view the raw vram state, which you can think of as an image of 1024x512 pixels
This can be triggerd with the keyboard button v.
Contributions and TODO
Check the trapezoid-core for more information about TODO items related to the emulator.
Also check the issues.
Really appreciate any contributions. Thanks!
License
This project is under MIT license.
NES is a product and/or trademark of Nintendo Co., Ltd. Nintendo Co., Ltd. and is not affiliated in any way with Plastic or its author
References
Most of the documentation for PSX components can be found in the consoledev website
Dependencies
~18–51MB
~881K SLoC