1 stable release
| 1.1.4 | Feb 20, 2024 |
|---|
#591 in Machine learning
Used in 2 crates
27KB
75 lines
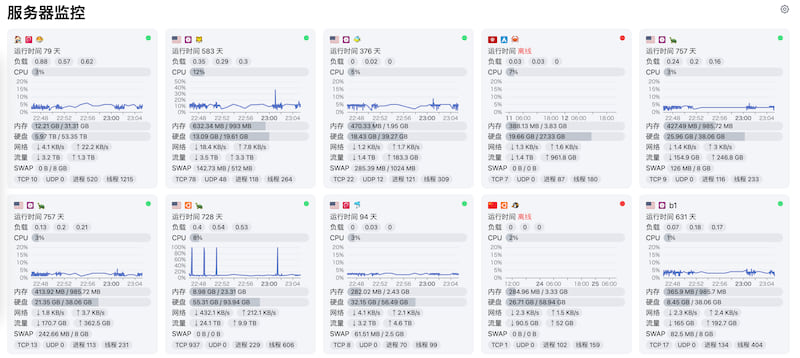
✨ Rust 版 ServerStatus 云探针
![]()
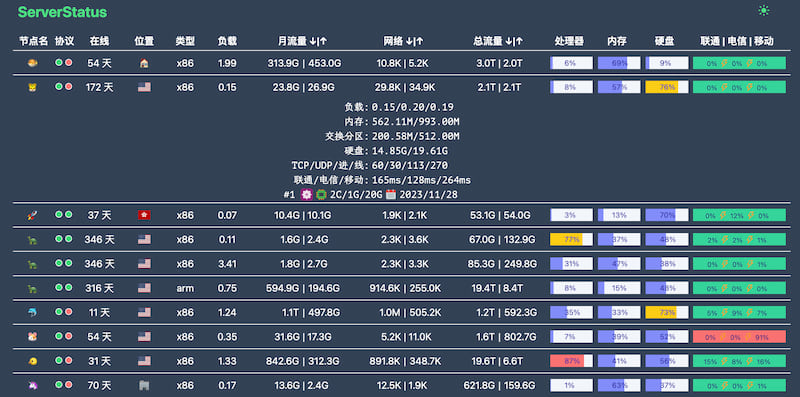
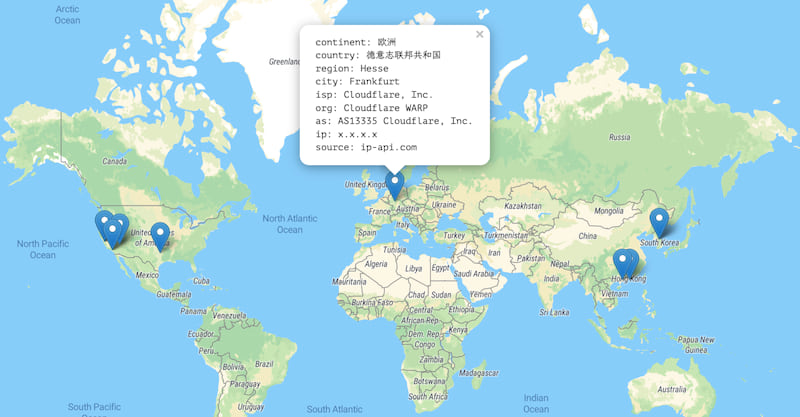
Table of Contents
1. 介绍
ServerStatus 威力加强版,保持轻量和简单部署,增加以下主要特性:
- 使用
rust完全重写server、client,单个执行文件部署 - 多系统支持
Linux、MacOS、Windows、Android、Raspberry Pi - 支持上下线和简单自定义规则告警 (
telegram、wechat、email、webhook) - 支持
http协议上报,方便部署到各免费容器服务和配合cf等优化上报链路 - 支持
cloudflare tunnels和mTLS部署 - 支持主机分组动态注册,简化配置
- 支持
vnstat统计月流量,重启不丢流量数据 - 支持
railway快速部署 - 支持
systemd开机自启 - 其它功能,如 🗺️ 见 wiki
演示:ssr.rs | cn dns | 下载:Releases | Changelog | 反馈:Discussions
📚 完整文档迁移至 doc.ssr.rs
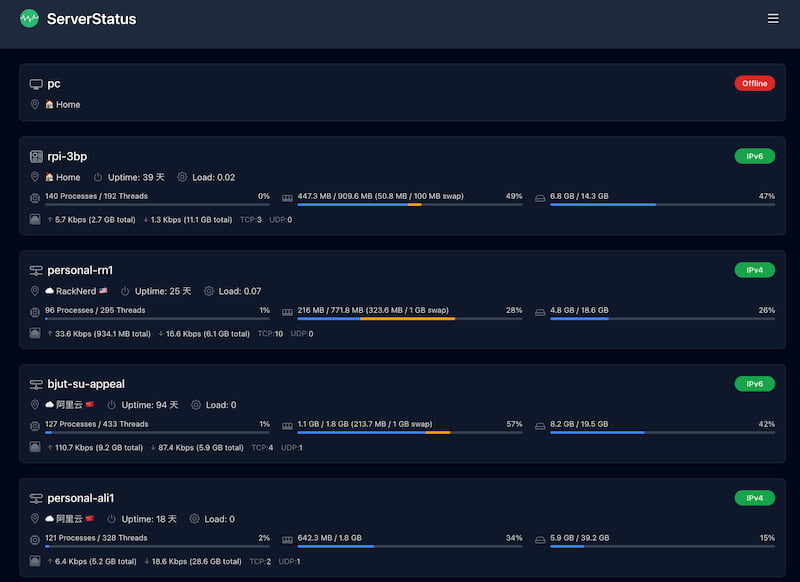
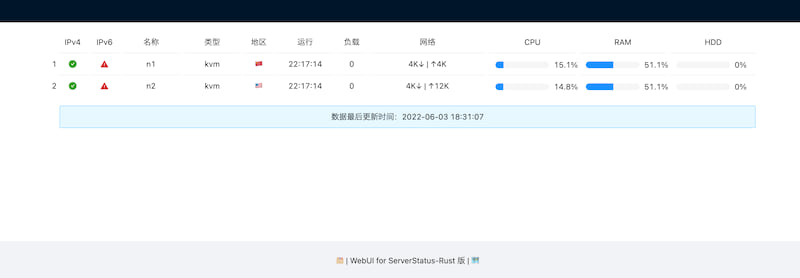
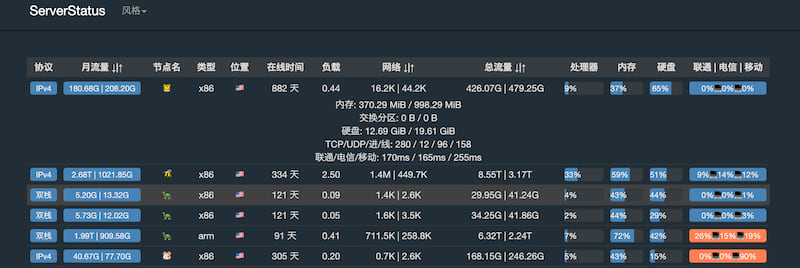
🍀 主题
如果你觉得你创造/修改的主题还不错,欢迎分享/PR,前端单独部署方法参考 #37

2. 安装部署
2.1 快速体验
# for CentOS/Debian/Ubuntu x86_64
mkdir -p /opt/ServerStatus && cd /opt/ServerStatus
# apt install -y unzip / yum install -y unzip
wget --no-check-certificate -qO one-touch.sh 'https://raw.githubusercontent.com/zdz/ServerStatus-Rust/master/scripts/one-touch.sh'
bash -ex one-touch.sh
# 部署完毕,打开 http://127.0.0.1:8080/ 或 http://<你的IP>:8080/
# 自定义部署可参照 scripts/one-touch.sh 脚本
2.2 快速部署
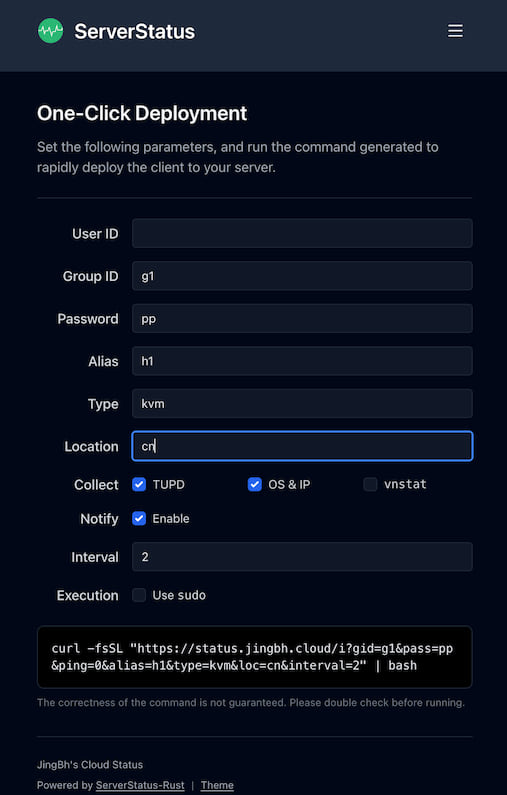
👉 快速部署
2.3 服务管理脚本
服务管理脚本说明
由 @Colsro & @Yooona-Lim 贡献
# 下载脚本
wget --no-check-certificate -qO status.sh 'https://raw.githubusercontent.com/zdz/ServerStatus-Rust/master/scripts/status.sh'

# 安装 服务端
bash status.sh -i -s

# 安装 客户端
bash status.sh -i -c
# or
bash status.sh -i -c protocol://username:password@master:port
# eg:
bash status.sh -i -c grpc://h1:p1@127.0.0.1:9394
bash status.sh -i -c http://h1:p1@127.0.0.1:8080

# 更多用法:
❯ bash status.sh

help:
    -i,--install    安装 Status
        -i -s           安装 Server
        -i -c           安装 Client
        -i -c conf      自动安装 Client
    -up,--upgrade   升级 Status
        -up -s          升级 Server
        -up -c          升级 Client
        -up -a          升级 Server和Client
    -un,--uninstall  卸载 Status
        -un -s           卸载 Server
        -un -c           卸载 Client
        -un -a           卸载 Server and Client
    -rc,--reconfig      更改 Status 配置
        -rc          更改 Client 配置
        -rc conf         自动更改 Client配置
    -s,--server     管理 Status 运行状态
        -s {status|start|stop|restart}
    -c,--client     管理 Client 运行状态
        -c {status|start|stop|restart}
    -b,--bakup      备份 Status
        -b -s          备份 Server
        -b -c          备份 Client
        -b -a          备份 Server and Client
    -rs,--restore    恢复 Status
        -rs -s          恢复 Server
        -rs -c          恢复 Client
        -rs -a          恢复 Server and Client
    -h,--help       查看帮助
若无法访问 Github:
    CN=true bash status.sh args
2.4 Railway 部署
懒得配置 Nginx,SSL 证书?试试
在 Railway 部署 Server
![]()
2.5 Heroku 部署
如何在 Heroku 上部署 Rust 版 ServerStatus 云探针
3. 服务端说明
3.1 配置文件 config.toml
# 侦听地址, ipv6 使用 [::]:9394
grpc_addr = "0.0.0.0:9394"
http_addr = "0.0.0.0:8080"
# 默认30s无上报判定下线
offline_threshold = 30

# 管理员账号,不设置默认随机生成,用于查看 /detail, /map
admin_user = ""
admin_pass = ""

# hosts 跟 hosts_group 两种配置模式任挑一种配置即可
# name 主机唯一标识,不可重复,alias 为展示名
# notify = false 单独禁止单台机器的告警,一般针对网络差,频繁上下线
# monthstart = 1 没启用vnstat时,表示月流量从每月哪天开始统计
# disabled = true 单机禁用
# location 支持国旗 emoji https://emojixd.com/group/flags
# 或国家缩写,如 cn us 等等,所有国家见目录 web/static/flags
# 自定义标签 labels = "os=centos;ndd=2022/11/25;spec=2C/4G/60G;"
# os 标签可选,不填则使用上报数据,ndd(next due date) 下次续费时间, spec 为主机规格
# os 可用值 centos debian ubuntu alpine pi arch windows linux
hosts = [
  {name = "h1", password = "p1", alias = "n1", location = "🏠", type = "kvm", labels = "os=arch;ndd=2022/11/25;spec=2C/4G/60G;"},
  {name = "h2", password = "p2", alias = "n2", location = "🏢", type = "kvm", disabled = false},
  {name = "h3", password = "p3", alias = "n3", location = "🏡", type = "kvm", monthstart = 1},
  {name = "h4", password = "p4", alias = "n4", location = "cn", type = "kvm", notify = true, labels = "ndd=2022/11/25;spec=2C/4G/60G;"},
]

# 动态注册模式,不再需要针对每一个主机做单独配置
# gid 为模板组id, 动态注册唯一标识,不可重复
hosts_group = [
  # 可以按国家地区或用途来做分组
  {gid = "g1", password = "pp", location = "🏠", type = "kvm", notify = true},
  {gid = "g2", password = "pp", location = "🏢", type = "kvm", notify = true},
  # 例如不发送通知可以单独做一组
  {gid = "silent", password = "pp", location = "🏡", type = "kvm", notify = false},
]
# 动态注册模式下,无效数据清理间隔,默认 30s
group_gc = 30

# 不开启告警,可忽略后面配置,或者删除不需要的通知方式
# 告警间隔默认为30s
notify_interval = 30
# https://core.telegram.org/bots/api
# https://jinja.palletsprojects.com/en/3.0.x/templates/#if
[tgbot]
# 开关 true 打开
enabled = false
bot_token = "<tg bot token>"
chat_id = "<chat id>"
# host 可用字段见 payload.rs 文件 HostStat 结构, {{host.xxx}} 为占位变量
# 例如 host.name 可替换为 host.alias,大家根据自己的喜好来编写通知消息
# {{ip_info.query}} 主机 ip,  {{sys_info.host_name}} 主机 hostname
title = "❗<b>Server Status</b>"
online_tpl =  "{{config.title}} \n😆 {{host.location}} {{host.name}} 主机恢复上线啦"
offline_tpl = "{{config.title}} \n😱 {{host.location}} {{host.name}} 主机已经掉线啦"
# custom 模板置空则停用自定义告警,只保留上下线通知
custom_tpl = """
{% if host.memory_used / host.memory_total > 0.5  %}
<pre>😲 {{host.name}} 主机内存使用率超50%, 当前{{ (100 * host.memory_used / host.memory_total) | round }}%  </pre>
{% endif %}

{% if host.hdd_used / host.hdd_total  > 0.5  %}
<pre>😲 {{host.name}} 主机硬盘使用率超50%, 当前{{ (100 * host.hdd_used / host.hdd_total) | round }}% </pre>
{% endif %}
"""

# wechat, email, webhook 等其它通知方式 配置详细见 config.toml
3.2 服务端运行
# systemd 方式, 参照 scripts/one-touch.sh 脚本 (推荐)

# 💪 手动方式
# help
./stat_server -h
# 手动运行
./stat_server -c config.toml
# 或
RUST_BACKTRACE=1 RUST_LOG=trace ./stat_server -c config.toml

# 测试配置文件是否有效
./stat_server -c config.toml -t
# 根据配置发送测试消息,验证通知是否生效
./stat_server -c config.toml --notify-test

# 🐳 docker 方式
wget --no-check-certificate -qO docker-compose.yml 'https://raw.githubusercontent.com/zdz/ServerStatus-Rust/master/docker-compose.yml'
wget --no-check-certificate -qO config.toml 'https://raw.githubusercontent.com/zdz/ServerStatus-Rust/master/config.toml'
touch stats.json
docker-compose up -d
4. 客户端说明
系统版本&架构
| OS | Release |
|---|---|
| Linux x86_64 | x86_64-unknown-linux-musl |
| Linux arm64 | aarch64-unknown-linux-musl |
| MacOS x86_64 | x86_64-apple-darwin |
| MacOS arm64 | aarch64-apple-darwin |
| Windows x86_64 | x86_64-pc-windows-msvc |
| Raspberry Pi | armv7-unknown-linux-musleabihf |
| Android 64bit | aarch64-linux-android |
| Android 32bit | armv7-linux-androideabi |
4.1 Rust 版 Client
# 公网环境建议 headscale/nebula 组网或走 https, 使用 nginx 对 server 套 ssl 和自定义 location /report
# alpine linux 需要安装相关命令 apk add procps iproute2 coreutils
# 如果 Rust 版客户端在你的系统无法使用,请切换到下面 4.2 Python 跨平台版本

# systemd 方式, 参照 scripts/one-touch.sh 脚本 (推荐)

# 💪 手动方式
# Rust 版本 Client
./stat_client -h
./stat_client -a "http://127.0.0.1:8080/report" -u h1 -p p1
# 或
./stat_client -a "grpc://127.0.0.1:9394" -u h1 -p p1
# 不同的主机可以运行相同的命令注册到同一组
./stat_client -a "http://127.0.0.1:8080/report" -g g1 -p pp --alias "$(hostname)"

# rust client 可用参数
./stat_client -h
OPTIONS:
    -6, --ipv6                   ipv6 only, default:false
    -a, --addr <ADDR>            [default: http://127.0.0.1:8080/report]
        --alias <ALIAS>          alias for host [default: unknown]
        --cm <CM_ADDR>           China Mobile probe addr [default: cm.tz.cloudcpp.com:80]
        --ct <CT_ADDR>           China Telecom probe addr [default: ct.tz.cloudcpp.com:80]
        --cu <CU_ADDR>           China Unicom probe addr [default: cu.tz.cloudcpp.com:80]
        --disable-extra          disable extra info report, default:false
        --disable-notify         disable notify, default:false
        --disable-ping           disable ping, default:false
        --disable-tupd           disable t/u/p/d, default:false
    -g, --gid <GID>              group id [default: ]
    -h, --help                   Print help information
        --ip-info                show ip info, default:false
        --ip-source <IP_SOURCE>  ip info source [env: SSR_IP_SOURCE=] [default: ip-api.com]
        --sys-info               show sys info, default:false
        --json                   use json protocol, default:false
        --location <LOCATION>    location [default: ]
    -n, --vnstat                 enable vnstat, default:false
        --vnstat-mr <VNSTAT_MR>  vnstat month rotate 1-28 [default: 1]
    -p, --pass <PASS>            password [default: p1]
    -t, --type <HOST_TYPE>       host type [default: ]
    -u, --user <USER>            username [default: h1]
    -V, --version                Print version information
    -w, --weight <WEIGHT>        weight for rank [default: 0]

# 一些参数说明
--ip-info       # 显示本机ip信息后立即退出,目前使用 ip-api.com 数据
--ip-source     # 指定 ip 信息源,ip-api.com / ip.sb / ipapi.co / myip.la
--sys-info      # 显示本机系统信息后立即退出
--disable-extra # 不上报系统信息和IP信息
--disable-ping  # 停用三网延时和丢包率探测
--disable-tupd  # 不上报 tcp/udp/进程数/线程数,减少CPU占用
-w, --weight    # 排序加分,微调让主机靠前显示,无强迫症可忽略
-g, --gid       # 动态注册的组id
--alias         # 动态注册模式下,指定主机的展示名字
# 总流量,网卡流量/网速统计
-i, --iface         # 非空时,只统计指定网口
-e, --exclude-iface # 排除指定网口,默认排除 "lo,docker,vnet,veth,vmbr,kube,br-"
4.2 Python 版 Client
Python 版 Client 说明
# Python 版本 Client 依赖安装
## Centos
yum -y install epel-release
yum -y install python3-pip gcc python3-devel
python3 -m pip install psutil requests py-cpuinfo

## Ubuntu/Debian
apt -y install python3-pip
python3 -m pip install psutil requests py-cpuinfo

## Alpine linux
apk add wget python3 py3-pip gcc python3-dev musl-dev linux-headers
apk add procps iproute2 coreutils
python3 -m pip install psutil requests py-cpuinfo

wget --no-check-certificate -qO stat_client.py 'https://raw.githubusercontent.com/zdz/ServerStatus-Rust/master/client/stat_client.py'

## Windows
# 安装 python 3.10 版本,并设置环境变量
# 命令行执行 pip install psutil requests
# 下载 https://raw.githubusercontent.com/zdz/ServerStatus-Rust/master/client/stat_client.py
pip install psutil requests py-cpuinfo

python3 stat_client.py -h
python3 stat_client.py -a "http://127.0.0.1:8080/report" -u h1 -p p1
5. 开启 vnstat 支持
vnstat 是Linux下一个流量统计工具,开启 vnstat 后,server 完全依赖客户机的 vnstat 数据来显示月流量和总流量,优点是重启不丢流量数据。
开启 vnstat 设置
# 在client端安装 vnstat
## Centos
sudo yum install epel-release -y
sudo yum install -y vnstat
## Ubuntu/Debian
sudo apt install -y vnstat

# 修改 /etc/vnstat.conf
# BandwidthDetection 0
# MaxBandwidth 0
# 默认不是 eth0 网口的需要置空 Interface 来自动选择网口
# 没报错一般不需要改
# Interface ""
systemctl restart vnstat

# 确保 version >= 2.6
vnstat --version
# 测试查看月流量 (刚安装可能需等一小段时间来采集数据)
vnstat -m
vnstat --json m

# client 使用 -n 参数开启 vnstat 统计
./stat_client -a "grpc://127.0.0.1:9394" -u h1 -p p1 -n
# 或
python3 stat_client.py -a "http://127.0.0.1:8080/report" -u h1 -p p1 -n
6. FAQ
如何使用自定义主题
更简单的方式 👉 #37
server {
  # ssl, domain 等其它 nginx 配置

  # 反代 /report 请求
  location = /report {
    proxy_set_header Host              $host;
    proxy_set_header X-Real-IP         $remote_addr;
    proxy_set_header X-Forwarded-For   $proxy_add_x_forwarded_for;
    proxy_set_header X-Forwarded-Proto $scheme;
    proxy_set_header X-Forwarded-Host  $host;
    proxy_set_header X-Forwarded-Port  $server_port;

    proxy_pass http://127.0.0.1:8080/report;
  }
  # 反代 json 数据请求
  location = /json/stats.json {
    proxy_set_header Host              $host;
    proxy_set_header X-Real-IP         $remote_addr;
    proxy_set_header X-Forwarded-For   $proxy_add_x_forwarded_for;
    proxy_set_header X-Forwarded-Proto $scheme;
    proxy_set_header X-Forwarded-Host  $host;
    proxy_set_header X-Forwarded-Port  $server_port;

    proxy_pass http://127.0.0.1:8080/json/stats.json;
  }
  # v1.4.0后,同样需要反代  /detail, /map

  # 其它 html,js,css 等,走本地文本
  location / {
    root   /opt/ServerStatus/web; # 你自己修改的主题目录
    index  index.html index.htm;
  }
}
如何源码编译
# 按提示安装 rust 编译器
curl --proto '=https' --tlsv1.2 -sSf https://sh.rustup.rs | sh
yum install -y openssl-devel
git clone https://github.com/zdz/ServerStatus-Rust.git
cd ServerStatus-Rust
cargo build --release
# 编译好的文件目录 target/release
如何自定义 ping 地址
# 例如自定义移动探测地址,用 --cm 指定地址
./stat_client -a "grpc://127.0.0.1:9394" -u h1 -p p1 --cm=cm.tz.cloudcpp.com:80

# 电信联通参数可以使用 -h 命令查看
./stat_client -h
OPTIONS:
    --cm <CM_ADDR>    China Mobile probe addr [default: cm.tz.cloudcpp.com:80]
    --ct <CT_ADDR>    China Telecom probe addr [default: ct.tz.cloudcpp.com:80]
    --cu <CU_ADDR>    China Unicom probe addr [default: cu.tz.cloudcpp.com:80]
关于这个轮子
之前一直在使用 Prometheus + Grafana + Alertmanager + node_exporter 做VPS监控,这也是业界比较成熟的监控方案,用过一段时间后,发现非生产环境,很多监控指标都用不上,运维成本有点大。
而 ServerStatus 很好,足够简单和轻量,一眼可以看尽所有小机机,只是 c++ 版本很久没迭代过,自己的一些需求在原版上不是很好修改,如自带 tcp 上报对跨区机器不是很友好,也不方便对上报的链路做优化 等等。这是学习 Rust 练手的小项目,所以不会增加复杂功能,保持小而美,简单部署,配合 Uptime Kuma 基本上可以满足个人大部分监控需求。
7. 相关项目
- https://github.com/BotoX/ServerStatus
- https://github.com/cppla/ServerStatus
- https://github.com/mojeda/ServerStatus
- https://github.com/cokemine/ServerStatus-Hotaru
- https://github.com/ToyoDAdoubiBackup/ServerStatus-Toyo
8. 最后
很高兴我的代码能跑在你的服务器上,如果对你有帮助的话,欢迎留下你的 star ⭐ 支持一下
Dependencies
~7–14MB
~169K SLoC