5 stable releases
| new 1.0.13 | May 10, 2025 |
|---|---|
| 1.0.12 | Apr 3, 2025 |
| 1.0.11 | Mar 6, 2025 |
| 1.0.9 | Feb 5, 2025 |
#97 in Machine learning
41 downloads per month
9MB
11K
SLoC
scxtop
scxtop is a top like utility for sched_ext schedulers. It collects and
aggregates system performance metrics and scheduler events via bpf and
aggregates the data in a live view across CPUs, LLCs, and NUMA nodes. It uses
ratatui for rendering the TUI.
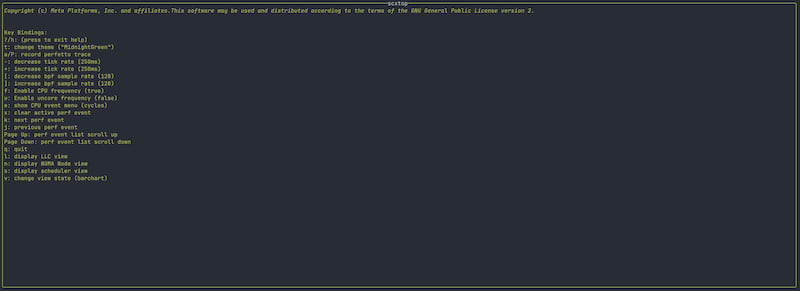
Using scxtop
scxtop must be run as root or with capabilities as it uses perf_event_open
as well as BPF programs for data collection. Use the help menu (h key is the
default to see keybindings) to view the current keybindings:
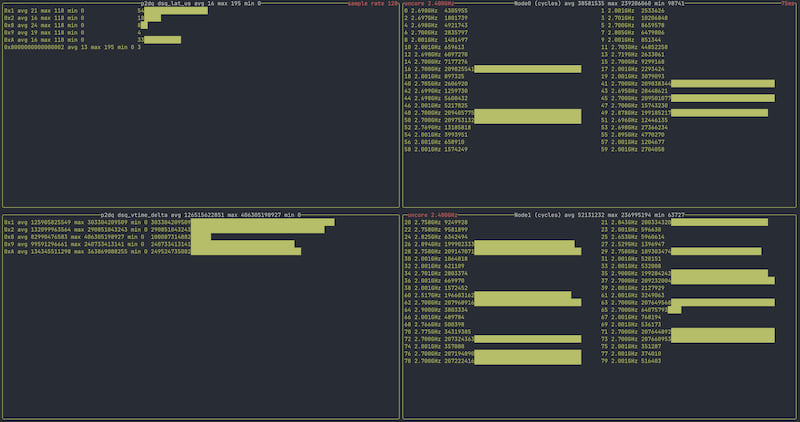
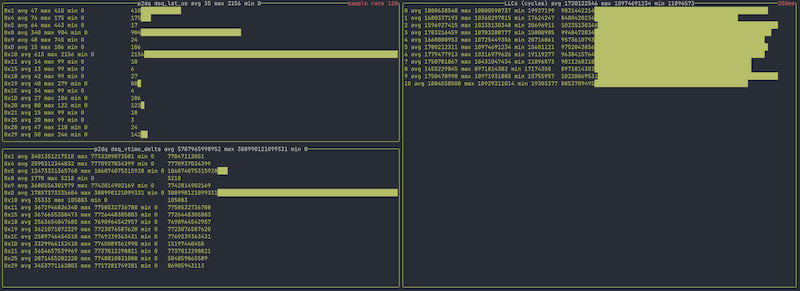
scxtop has multiple views for presenting aggregated data. The bar chart view
displays live value bar charts:
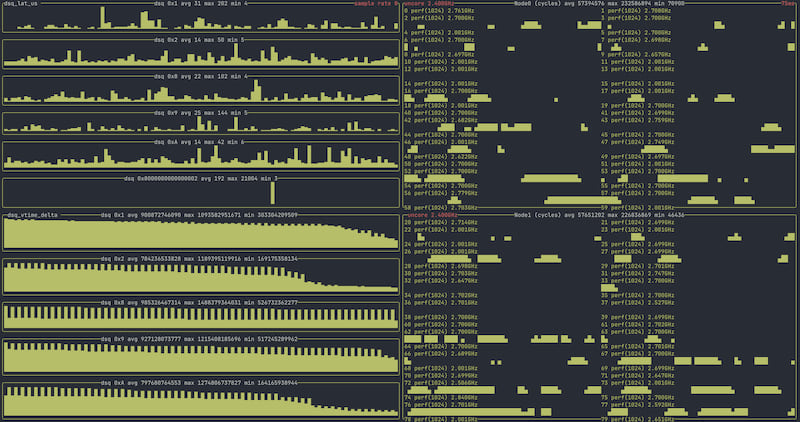
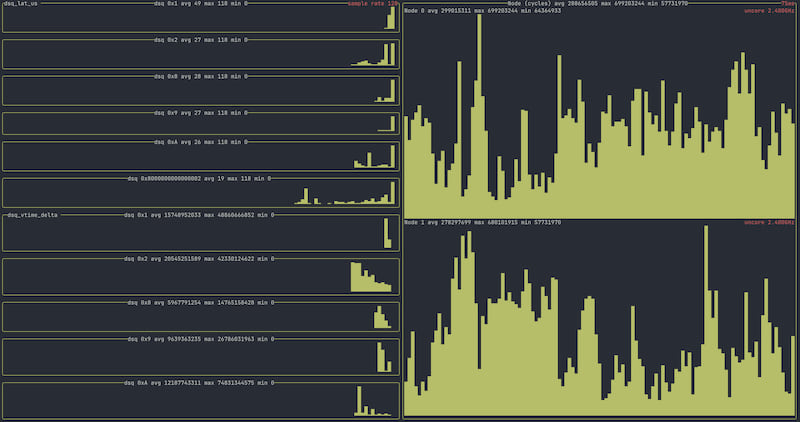
The sparkline view is useful for seeing a historical view of the metrics:
Configuration
scxtop can use a configuration file, which can be generated using the S key
in the default keymap configuration. The config file follows the
XDG Base Directory Specification.
An example configuration shows customization of default tick rates, theme and keymaps:
theme = "IAmBlue"
tick_rate_ms = 250
debug = false
exclude_bpf = false
worker_threads = 4

[keymap]
d = "AppStateDefault"
"?" = "AppStateHelp"
"[" = "DecBpfSampleRate"
q = "Quit"
"+" = "IncTickRate"
u = "ToggleUncoreFreq"
"Page Down" = "PageDown"
S = "SaveConfig"
Up = "Up"
P = "RecordTrace"
- = "DecTickRate"
L = "ToggleLocalization"
t = "ChangeTheme"
"]" = "IncBpfSampleRate"
Down = "Down"
l = "AppStateLlc"
k = "NextEvent"
a = "RecordTrace"
j = "PrevEvent"
v = "NextViewState"
h = "AppStateHelp"
n = "AppStateNode"
s = "AppStateScheduler"
e = "AppStateEvent"
w = "RecordTrace"
f = "ToggleCpuFreq"
Enter = "Enter"
"Page Up" = "PageUp"
x = "ClearEvent"
Shell completions
scxtop is able to generate shell completions for various shells using the
scxtop generate-completions subcommand:
scxtop generate-completions -h
Usage: scxtop generate-completions [OPTIONS]

Options:
  -s, --shell <SHELL>    The shell type [default: bash] [possible values: bash, elvish, fish, powershell, zsh]
      --output <OUTPUT>  Output file, stdout if not present
  -h, --help             Print help
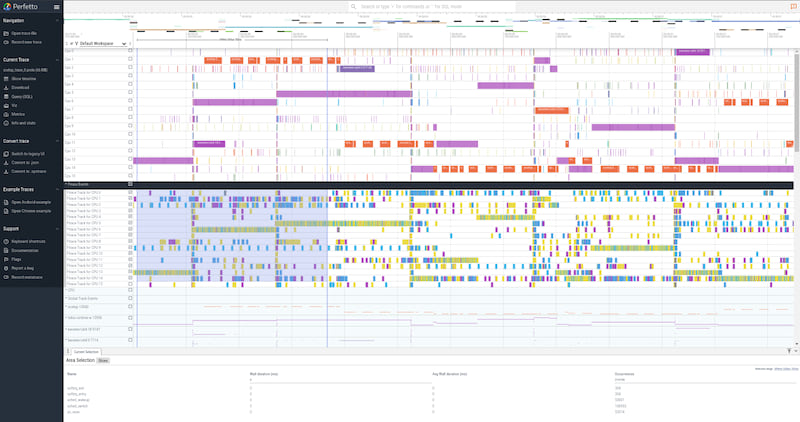
Generating Traces
scxtop is able to generate Perfetto compatible traces.
The trace data also contains DSQ (dispatch queue) data for any active sched_ext
scheduler. Soft IRQs are also collected as part of the trace. Traces can be
collected with the scxtop trace subcommand as well as from keybindings from
the TUI.
Aggregating Across Hardware Boundaries
scxtop can be used to observe scheduling decisions across hardware boundaries
by using the LLC aggregated view:
Scheduler Stats
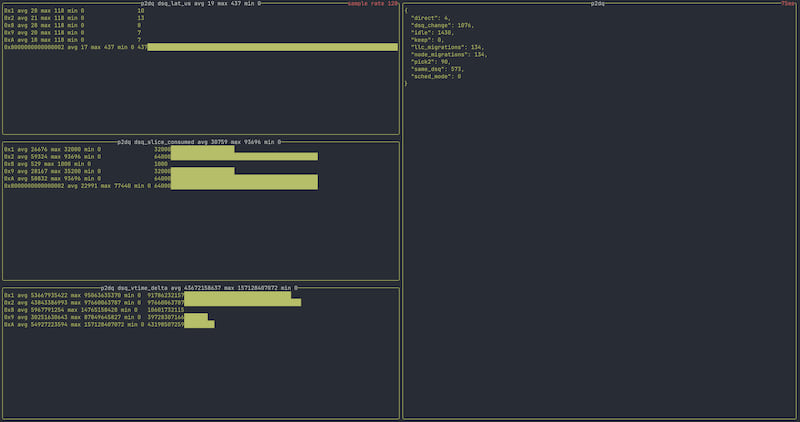
The scheduler view displays scheduler related stats. For schedulers that use
scx_stats the stats
will be collected and aggregated. The scheduler view displays stats such as DSQ latency,
DSQ slice consumed (how much of the given timeslice was used), and vtime delta. Vtime
delta is useful in understanding the progression of scheduler vtime. For most schedulers
vtime delta should remain rather stable as DSQs are consumed. If a scheduler is using FIFO
scheduling this field may be blank.
Dependencies
~42–61MB
~1M SLoC