8 releases
Uses new Rust 2024
| new 0.3.5 | May 17, 2025 |
|---|---|
| 0.3.4 | May 14, 2025 |
| 0.2.0 | Apr 27, 2025 |
| 0.1.0 | Apr 19, 2025 |
#31 in Visualization
731 downloads per month
4MB
5.5K
SLoC
plox — Time Plots from Logs
🚀 What It Does
You give it logs. It gives you a graph.
Turn timestamped logs into clean plots. Extract numeric values from log files and plot them over time. Fully CLI-driven. Regex-based. Configurable.
For 📸 real-world usage examples, see the sample gallery. Browse full CLI reference.
✨ Features
-
Plot over time:
- Numeric fields (e.g.
"duration: 125ms") - Event markers when patterns appear
- Event counts and time deltas between matches
- Numeric fields (e.g.
-
Parsing logs:
- Extract numeric values from logs using regex
- Parse flexible timestamp formats
- Support unit-aware values
- Filter log lines using fast string-based guards
-
Compose multi-panel layouts to keep metrics organized
-
Compare multiple logs using per-file layouts and panel duplication
-
Save and reuse graph setups via TOML config files
-
Output PNG graphs (via gnuplot) and CSV caches for fast redraws
-
Includes tools to explore your data:
stat→ shows summary stats and histogramcat→ prints raw extracted values
🧪 Examples
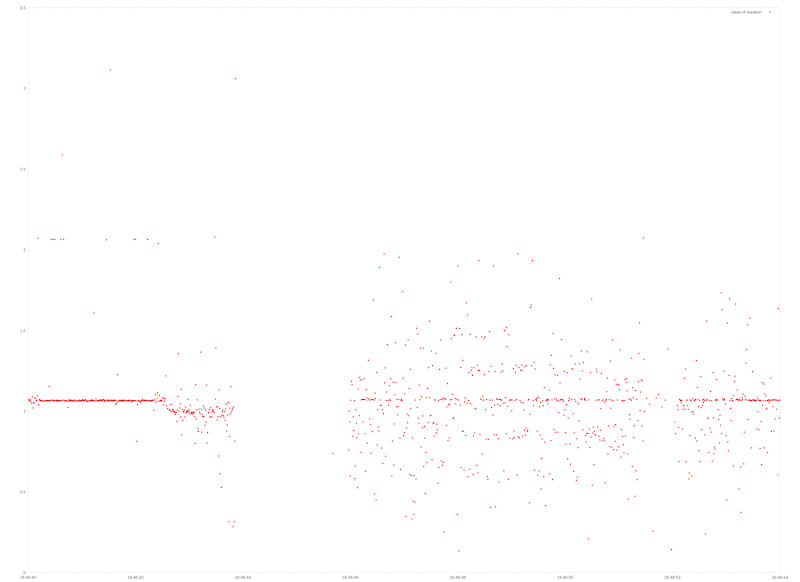
The simplest usage, typical first call:
plox graph \
	  --input tests/examples/checker.log \
	  --plot duration
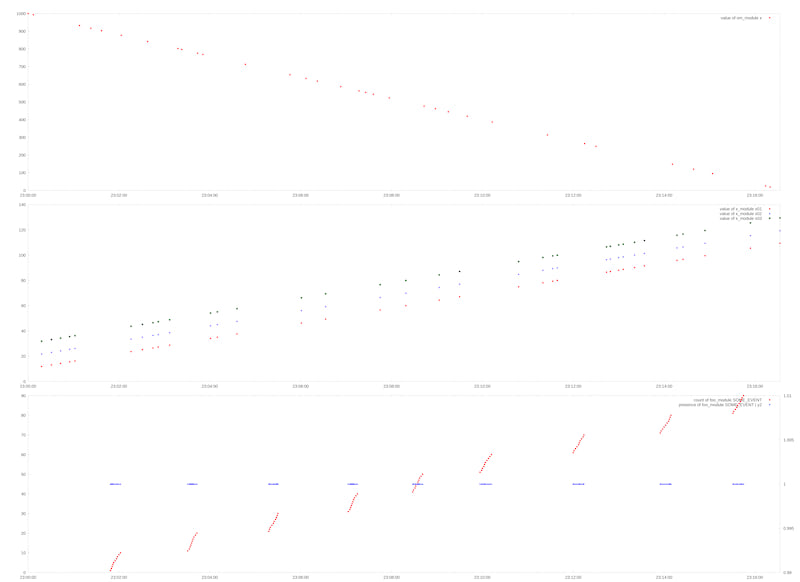
More complex usage:
plox graph \
	  --input  tests/examples/some.log \
	  --output tests/.output/panels.png \
	  --timestamp-format "[%s]" \
	  --plot om_module x \
	  --panel \
	  --plot x_module x01 \
	  --plot x_module x02 \
	  --plot x_module x03 \
	  --panel \
	  --event-count foo_module SOME_EVENT \
	  --event foo_module SOME_EVENT 1.0 --yaxis y2 --style points
For more examples refer to sample gallery.
See plox --help for a complete list of subcommands and options.
📦 Install
cargo install plox
or
git clone git@github.com:michalkucharczyk/plox.git
cd plox
cargo build --release
# use ./target/release/plox
gnuplot is required for rendering PNGs — install it via your system package manager.
🔧 Advanced topics
In this section:
- Stats and Raw Values
- Multiple Log Files
- Panel Duplication
- Time Ranges
- Graph Config
- Output Files
- Case Study
📊 Displaying Stats and Raw Values
Working with extracted datasets often benefits from quick statistical insight, and plox provides built-in tools for that.
plox stat \
	  --input tests/examples/checker.log \
	  field-value TRACE duration
This command displays basic statistics (count, min, max, mean, median, percentiles) and shows an ASCII histogram to help you quickly understand the distribution of extracted values:
 count: 1130
   min: 0.13308
   max: 3.114183
  mean: 1.0390050628318581
median: 1.0636225000000001
   q75: 1.0734786666666667
   q90: 1.2681463333333334
   q95: 1.4730833499999998
   q99: 2.06401263

# Each ∎ is a count of 17
#
    0.1331 -     0.6312 [  66 ]: ∎∎∎
    0.6312 -     1.1293 [ 856 ]: ∎∎∎∎∎∎∎∎∎∎∎∎∎∎∎∎∎∎∎∎∎∎∎∎∎∎∎∎∎∎∎∎∎∎∎∎∎∎∎∎∎∎∎∎∎∎∎∎∎∎
    1.1293 -     1.6274 [ 171 ]: ∎∎∎∎∎∎∎∎∎∎
    1.6274 -     2.1255 [  34 ]: ∎∎
    2.1255 -     2.6236 [   1 ]:
    2.6236 -     3.1217 [   2 ]:
    3.1217 -     3.6199 [   0 ]:
    3.6199 -     4.1180 [   0 ]:
    4.1180 -     4.6161 [   0 ]:
    4.6161 -     5.1142 [   0 ]:
📂 Working with Multiple Log Files
Multiple input logs can be passed via --input:
plox graph --input a.log,b.log ...
By default, each line (plot, event, etc.) is applied to all input files — unless it is bound to a specific file.
🔗 Binding a Line to a Specific File
To target a specific log file:
- Use
--file-id <N>to refer to the Nth file in--input - Or use
--file-name <path>to bind directly to a filename
# apply this line only to c.log:
--input a.log,b.log,c.log --plot my-guard duration --file-id 2

# apply this line to global-errors.log which is not used in --input:
--input a.log,b.log --plot my-guard "duration: ([0-9.]+)" --file-name globab-errors.log
✅ Without Binding, Lines Apply to All Inputs
If --file-id or --file-name is not set, the line is applied to every file in --input.
This is useful if comparing logs from the same system.
🔄 Panel Duplication
Use --per-file-panels to separate outputs per input log, which may improve readability of the graph.
This flag automatically duplicates each panel once per input file, if that panel includes any unbound lines. Then, it resolves each unbound line to exactly one input.
How it works
- Unbound lines (no
file-idorfile-name) → assigned to exactly one file per duplicated panel - Bound lines → copied into all panels unchanged
- Each final panel = one log file + one consistent layout
Why it matters
This makes it easy to apply a single graph layout across multiple logs, with clean isolation:
plox graph --input a.log,b.log --per-file-panels \
  --plot worker "duration: ([0-9.]+)" \
  --file-name e.log --event-count "ERROR"
Results in:
| Panel | Line | File |
|---|---|---|
| 0 | duration |
a.log |
| 0 | ERROR (explicit file-name) |
e.log |
| 1 | duration |
b.log |
| 1 | ERROR (explicit file-name) |
e.log |
This lets applying the same layout to multiple inputs while keeping shared reference lines intact.
🕒 Time Ranges and Alignment
Each panel computes its own time range by merging the time spans of all its lines. This behavior is controlled by --time-range-mode, which determines whether the panel uses the full union or only the overlapping portion of its lines.
The X-axis range across panels can then be left independent or aligned globally. This is configured using --panel-alignment-mode.
If --time-range is provided, it overrides all automatic range calculation and applies a fixed global time window to all panels. Useful for "zooming" some interesting area.
📝 Graph Config
Once the command-line version becomes too complex to maintain comfortably, the configuration can be saved to a TOML file using -w <graph-config-file>. This creates a declarative layout that’s easy to version, inspect, and edit.
Below is a sample graph configuration representing where we eventually land in the case study. It’s functionally identical to the CLI commands above but significantly easier to maintain as the graph grows.
[[panels]]

[[panels.lines]]
guard = "prune:"
field = "validated_counter"
style = "points"
marker_size = 3.0
marker_type = "dot"
marker_color = "red"
title = "validation count in prune"

[[panels.lines]]
guard = "prune"
field = 'took:([\d\.]+)(\w+)?'
style = "points"
marker_size = 3.0
marker_type = "cross"
marker_color = "blue"
title = "prune duration [y2][ms]"
yaxis = "y2"


[[panels]]
panel_title = "txs"
legend = true

[[panels.lines]]
guard = "maintain"
field = 'txs=\((\d+),\s+\d+\)'
style = "steps"
line_color = "red"
title="watched txs"

[[panels.lines]]
guard = "maintain"
field = 'txs=\(\d+,\s+(\d+)\)'
style = "steps"
line_color = "blue"
line_width=2
title="unwatched txs"
📄 Output Files
Running plox graph generates:
png— rendered plot in given location (default:graph.png, or via--output)gnuplot— generated script (same location and name as PNG)- CSV cache per log file (default:
.plox/next to the log file), can be controlled by--cache-dir,
Regenration of CSV cache can be forced with --force-csv-regen flag.
Additionally the output PNG can be saved next to the input log file (if one log), or to in a common parent directory (if multiple input files are given) if --inline-output <FILE> is used.
📊 Case Study
This section walks through a real-world example of using plox to build a graph configuration progressively via the CLI — starting with a single metric, layering in more complexity, and finally extracting it into a reusable config.
Some log
cat eve.log | grep "prune:\|maintain"
2025-04-22 09:31:00.885  INFO  maintain txs=(29382, 0) a=1 i=6 views=[(37, 15000, 0)] event=NewBestBlock { hash: 0x0e506bf406bd6ef327c272ab036fe909ce6562608d2dbd34706a49b2f827824f, tree_route: None } duration=56.206398ms
2025-04-22 09:31:13.081 DEBUG  prune: validated_counter=2, known_txs_count: 7191, unknown_txs_count: 2399, reused_txs_count: 2397, took:4.708552ms
2025-04-22 09:31:13.091 DEBUG  prune: validated_counter=2, known_txs_count: 7191, unknown_txs_count: 2399, reused_txs_count: 2397, took:12.98374ms
2025-04-22 09:31:13.097 DEBUG  prune: validated_counter=2, known_txs_count: 7191, unknown_txs_count: 2, reused_txs_count: 0, took:17.462902ms
2025-04-22 09:31:23.246 DEBUG  prune: validated_counter=2, known_txs_count: 952, unknown_txs_count: 2, reused_txs_count: 0, took:4.187313801s
2025-04-22 09:31:25.586  INFO  maintain txs=(68222, 0) a=2 i=4 views=[(37, 60712, 0), (39, 55211, 0)] event=NewBestBlock { hash: 0x4f9767d3d74b5d8ea24c27b89687353d710e135d7a2807988197a002a87e4727, tree_route: None } duration=6.576908462s
2025-04-22 09:31:25.795 DEBUG  prune: validated_counter=2, known_txs_count: 2397, unknown_txs_count: 2, reused_txs_count: 0, took:16.699269ms
2025-04-22 09:31:25.935  INFO  maintain txs=(65825, 0) a=2 i=4 views=[(37, 61031, 0), (40, 53840, 0)] event=NewBestBlock { hash: 0x49ebabc44e86b9fd10448b427a75f8414c664ef9d80fa6afc5edb1fe459cdd3f, tree_route: None } duration=231.082854ms
2025-04-22 09:31:31.920 DEBUG  prune: validated_counter=2, known_txs_count: 2397, unknown_txs_count: 2, reused_txs_count: 0, took:540.608µs
2025-04-22 09:31:31.987  INFO  maintain txs=(78598, 0) a=2 i=5 views=[(37, 73804, 0), (41, 64216, 0)] event=NewBestBlock { hash: 0xaa56cbaa429751a59398eb6a22c252065bac177889020bc76c45a775d4d49b7a, tree_route: None } duration=960.324727ms
2025-04-22 09:31:37.058 DEBUG  prune: validated_counter=2, known_txs_count: 2397, unknown_txs_count: 2, reused_txs_count: 0, took:640.847µs
2025-04-22 09:31:37.125  INFO  maintain txs=(76201, 0) a=2 i=5 views=[(37, 73804, 0), (42, 61819, 0)] event=NewBestBlock { hash: 0xa429dfe56c6cf9b01e28313c7bcf72b5964794fe62dbb5c3ade3c21827379e18, tree_route: None } duration=146.739374ms
2025-04-22 09:31:42.837 DEBUG  prune: validated_counter=2, known_txs_count: 2397, unknown_txs_count: 2, reused_txs_count: 0, took:565.728µs
2025-04-22 09:31:42.897  INFO  maintain txs=(78470, 0) a=1 i=5 views=[(43, 64088, 0)] event=NewBestBlock { hash: 0x0308aedb05641a4418c43e0c064e516834182157fa3d8017abf28a5fb117e5db, tree_route: None } duration=160.865349ms
2025-04-22 09:31:48.966 DEBUG  prune: validated_counter=2, known_txs_count: 2397, unknown_txs_count: 2, reused_txs_count: 0, took:623.898µs
...
2025-04-22 09:32:36.622 DEBUG tokio-runtime-worker txpool: prune: validated_counter=2, known_txs_count: 2397, unknown_txs_count: 2, reused_txs_count: 0, took:648.029µs
2025-04-22 09:32:43.346 DEBUG tokio-runtime-worker txpool: prune: validated_counter=2, known_txs_count: 2397, unknown_txs_count: 2, reused_txs_count: 0, took:599.498µs
🖥️ CLI Workflow
A sequence of plox graph commands that evolve from a simple one-liner to a complete multi-panel, multi-metric graph.
# basic plot: extract one value from logs
plox graph --input eve.log \
  --plot prune "validated_counter"

# add another value: prune duration
plox graph --input eve.log \
  --plot prune "validated_counter" \
  --plot prune "took:([\d.]+)(\w+)?"

# split into separate panels for clarity
plox graph --input eve.log \
  --plot prune "validated_counter" \
  --panel \
  --plot prune "took:([\d.]+)(\w+)?"

# switch to points with marker size
plox graph --input eve.log \
  --plot prune "validated_counter" --style points --marker-size 3 \
  --panel \
  --plot prune "took:([\d.]+)(\w+)?" --style points --marker-size 3

# write a graph config file (too complex for cli - file editing becomes more convenient)
plox graph --input eve.log \
  --plot prune "validated_counter" --style points --marker-size 3 \
  --panel \
  --plot prune "took:([\d.]+)(\w+)?" --style points --marker-size 3 \
  -w prune.toml

# try to extract first number from 'txs=(.., ..)' in 'maintain...' lines:
graph --input eve.log  \
   --plot maintain "txs=\((\d+),\s+\d+\)"

# edit/iterate the config, extract more data
plox graph --input eve.log -c prune.toml -o graph-old.png

# compare to another run
plox graph --input eve-new.log -c prune.toml -o graph-new.png

# apply same config to multiple files with per-file layout
plox graph --input charlie.log,ferdie.log,dave.log,eve.log \
  -c prune.toml --per-file-panels -o graph-all.png
🚧 Status
Actively under development — feedback welcome!
📝 License
Licensed under either of:
- MIT License
- Apache License 2.0
at your option.
Dependencies
~27–40MB
~693K SLoC