3 unstable releases
| 0.2.1 | Apr 20, 2023 |
|---|---|
| 0.2.0 | Dec 23, 2021 |
| 0.1.0 | Nov 14, 2021 |
#7 in #rates
43KB
923 lines
ToTop
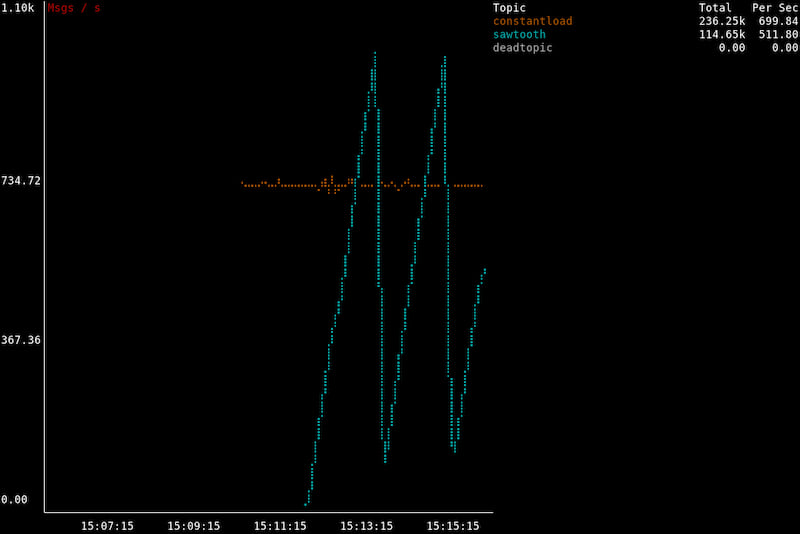
Kafka Table of Topics
A quick TUI for grasping the message ingestion rate in your topics. Run it in your k8s cluster:
kubectl run totop -i --tty --image=docker.io/liftm/kafka-totop -- -b $your_kafka_host:9092
This is not a Kafka swiss army knife like kcat, kaf, kcli or zoe. But it does one thing that those don't(?) do: display a graph of message throughput!
Of course, a proper cluster setup would have some kind of monitoring architecture that would give you this information (e.g. based on the prometheus/jmx_exporter). But when you're debugging, chances are you don't have a proper setup yet. ToTop is for those "one-off" situations: it pulls the necessary information from the normal Kafka listening port.
This repo is a spin-off of light-kafka-exporter.
Dependencies
~22–36MB
~446K SLoC