1 unstable release
| 0.1.0 | Apr 15, 2025 |
|---|
#505 in Visualization
110 downloads per month
700KB
12K
SLoC
A customizable graphing calculator for CalcScript.
Usage
Creating a graph is as simple as creating a Graph object, adding expressions
and points with Graph::add_expr / Graph::try_add_expr and
Graph::add_point, and finally calling Graph::draw. The result can be
written to a file in PNG and SVG format.
See the module-level documentation for more information.
Example
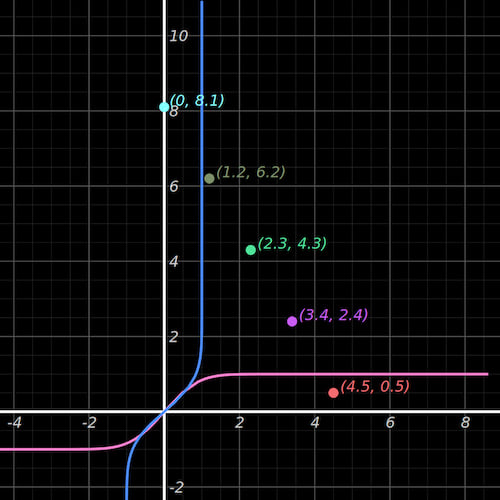
Graph the expressions x = erf(y) and y = erf(x) with the viewport centered
on the points (0, 8.1), (1.2, 6.2), (2.3, 4.3), (3.4, 2.4), and (4.5, 0.5), then write the result to erf-output.png:
use cas_graph::Graph;
use std::fs::File;

fn main() -> Result<(), Box<dyn std::error::Error>> {
    let surface = Graph::default()
        .try_add_expr("erf(y)").unwrap()
        .try_add_expr("erf(x)").unwrap()
        .add_point((0.0, 8.1))
        .add_point((1.2, 6.2))
        .add_point((2.3, 4.3))
        .add_point((3.4, 2.4))
        .add_point((4.5, 0.5))
        .center_on_points()
        .draw()?;

    let mut file = File::create("erf-output.png")?;
    surface.write_to_png(&mut file)?;

    Ok(())
}
Output (note: colors were randomly chosen; random color selection is not included in the example code):
Dependencies
~9MB
~140K SLoC