5 releases (3 breaking)
| 0.5.1 | Aug 10, 2023 |
|---|---|
| 0.5.0 | Jul 23, 2023 |
| 0.4.0 | Jul 23, 2023 |
| 0.3.0 | Jul 14, 2023 |
| 0.1.0 | Jul 8, 2023 |
#4 in #file-info
57KB
1K
SLoC
System info collector
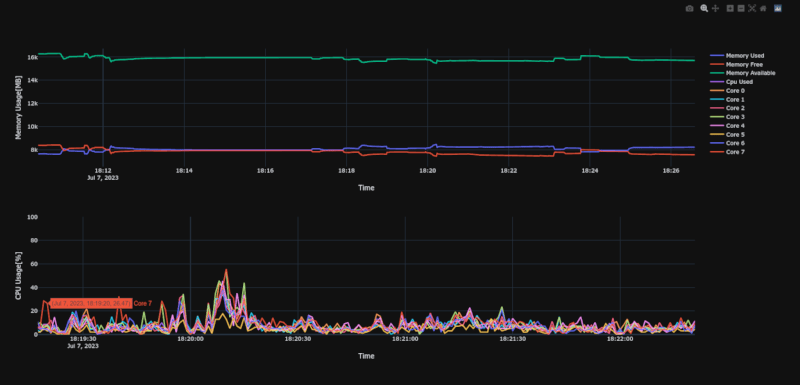
This is simple app to collect data about system cpu and memory usage over time.
After collecting results into csv file, html file can be created with plot.
Why?
I needed a simple and fast application to collect basic information about the amount of RAM used and CPU consumption on a slow(4x1Ghz) 32 bit ARM computer which uses custom Linux OS build with Yocto.
I looked at a few applications like grafana, but they are too heavy or work in a client server architecture which in this case I would prefer to avoid.
How to use it?
This is console app, so that means that you need to use terminal to use it.
./system_info_collector -l debug -a collect-and-convert -o
should once per second print debug message about refreshed CPU and memory usage.
After a while you can click Ctrl+C once to stop collecting data and wait for automatic preparing and opening prepared
html plot data.
https://github.com/qarmin/system-info-collector/assets/41945903/7ac510b5-babf-4d04-9624-34d83b8f1866
Performance and memory usage
During testing on i7-4770, app used stable 15-20MB Ram and most of the time, cpu usage was lower than 0.1%.
Sys-info library which I use have quite big overhead(usually few ms) when finding cpu/ram usage for processes due opening unnecessary files, so I plan to do some computations manually. So if you want to use as little resources as possible, you should use only collect basic os info without any processes(this is default mode).
In collect mode, app only needs to read cpu/ram usage and then save it to file, so that is why it uses so little resources.
Converting csv file to html file is more resource intensive, so should be done on more powerful computer.
Results from testing on i7-4770 250000 samples for memory, cpu total and per core usage - with 1s interval, collecting such number of samples should take ~3 days(I used smaller interval to mimic real usage):
Example of first lines of csv file:
INTERVAL_SECONDS=1,CPU_CORE_COUNT=8,MEMORY_TOTAL=23943.89,SWAP_TOTAL=2048.00,UNIX_TIMESTAMP_START_TIME=1690142980.2999594,APP_VERSION=0.4.0,CUSTOM_0=FIREFOX
SECONDS_SINCE_START,MEMORY_USED,SWAP_USED,CPU_USAGE_TOTAL,CUSTOM_0_CPU,CUSTOM_0_MEMORY
0.24,11031.20,0.00,49.66,0.00,1111.25
1.24,11037.60,0.00,16.75,2.11,1111.25
2.24,11039.49,0.00,19.14,3.55,1110.93
3.24,11040.23,0.00,13.27,2.17,1110.93
4.24,11047.52,0.00,16.32,4.65,1111.61
- CSV file size: 19.55 MiB
- Loading and parsing csv file: 407 ms
- HTML file size: 129 MiB (new versions use simple regex minimizer, so size should be ~30% smaller)
- Creating html file: 1.68 s
Example commands
Collect used memory and cpu usage in interval of 1 second and save it to system_data.csv file
./system_info_collector
Collect and convert csv data and automatically open html file in browser, additionally will show more detailed logs
./system_info_collector -l debug -a collect-and-convert -o
Convert csv data file into html document with plot and open it in browser
./system_info_collector -a convert -d /home/user/data.csv -p /home/user/plot.html -o
Collect all basic data with interval of 0.2 seconds
./system_info_collector -l debug -a collect-and-convert -o -m memory-used -m memory-free -m memory-available -m cpu-usage-total -m cpu-usage-per-core -c 0.2
Collect memory and cpu usage of selected processes - will try to find process with command containing firefox in
name - FIREFOX name will be used later in plot.
App can only track 1 process with certain name at once, so if two or more processes contains firefox in name, only
info about first will be collected
./system_info_collector -e "FIREFOX|firefox" -e "Event Handler|/usr/bin/event_handler --timeout"
Shows help about available arguments
./system_info_collector --help
Running app when OS starts(Linux)
Simple way to collect OS data from start, is to create simple systemd service.
To do this, copy app into /usr/bin folder and create folder for collected data
sudo cp system_info_collector /usr/bin/system_info_collector
sudo mkdir -p /opt/system_info_collector/ # To collect reports
creating service content
sudo touch /etc/systemd/system/system-info-collector.service
sudo gedit /etc/systemd/system/system-info-collector.service # open it with any text editor - I used gedit
paste this code with modified arguments:
[Unit]
Description=System Data Collector

[Service]
ExecStart=/usr/bin/system_info_collector -d /opt/system_info_collector/data.csv

[Install]
WantedBy=default.target
now start service
sudo systemctl daemon-reload
sudo systemctl start system-info-collector
sudo systemctl status system-info-collector # This should print "active (running)" if everything works fine, if there is failure, check log to see what happened
sudo systemctl enable system-info-collector # To enable running service when OS starts
now you can convert collected data with simple command
system_info_collector -a convert -d /opt/system_info_collector/data.csv -p /tmp/plot.html -o
CPU/Memory/Swap results
Cpu usage is shown in range between 0 and 100%, if computer have more than 1 core, cpu usage is divided by number of cores, to get value in proper range.
Memory and swap usage are shown in MiB, with range from 0 to total memory/swap size.
When checking for processes -1 is visible both in cpu/memory plot if searched process is not found.
Data file compatibility
Compatibility between different versions of app is not guaranteed, so if you want to collect create graphs from csv file, be sure that you use the same version of app(csv file contains inside info which version of app was used).
Usually incompatibilities are quite easy to workaround by manually adding/removing records from csv file.
OS Support
Currently, fully supported is only Linux, due using manually reading /proc files(performance reasons).
App should also fully work on Mac, but on Windows capturing process cpu/memory usage is not supported(except that, everything should work fine).
License
MIT License
Copyright (c) 2023 Rafał Mikrut and contributors
Dependencies
~20–31MB
~363K SLoC