7 releases
| 0.10.0 | Mar 4, 2023 |
|---|---|
| 0.9.14 | Jun 28, 2020 |
| 0.9.12 | May 22, 2020 |
#675 in HTTP server
1MB
1.5K
SLoC
stylus 

Stylus (style + status) is a lightweight status page for home infrastructure. Configure a set of bash scripts that test the various parts of your infrastructure, set up HTML/SVG with a diagram of your network, and stylus will generate you a dynamic stylesheet to give you a visual overview of the current state.
Note that this project was originally written using deno, but was rewritten in Rust to support Raspberry Pis. The
original deno source is available in the deno branch.
Running
See the wiki page on running Stylus here.
Theory of operation
Stylus acts as a webserver with special endpoints and a status monitoring tool.
The status monitoring portion is based around scripts, written in any shell scripting language you like. Each
script is run on an interval, and if the script returns 0 that is considered "up" for a given service. If the
service times out, or returns a non-zero error this is considered a soft ("yellow") or hard ("red") failure.
The special endpoints available on the webserver are:
/style.css: A dynamically generated CSS file based on the current/status.json: A JSON representation of the current state
The style.css endpoint may be linked by a HTML or SVG file served from the static directory that is configured. If
desired, the HTML page can dynamically refresh the CSS periodically using Javascript. See the included example for a
sample of how this might work.
Getting started
The first step to get started is copying the example to a location you'd like to use to run your status monitoring
scripts. For each of the servers you'd like to monitor, create a new subdirectory under monitor.d with the name of
that server.
Using a tool like diagrams.net, create an SVG diagram of your network. Attach an SVG DOM attribute to the elements
you'd like to style with status changes. If you're using diagrams.net, this can be done using the svgdata plugin.
Alternatively, you can use the automatic identifiers generated by your SVG editor as your monitoring identifiers.
From the SVG you've generated, create CSS selectors and rules that will apply styles to the appropriate elements as
statuses change. The SVG fill attribute is a good candidate to change, but ensure that you're using !important on
all your rules to override the fill colors created by your SVG editor.
Configuration
Example config.yaml for a Stylus install. This configuration attaches metadata to the various states and has
selectors that apply to both and HTML (for a status table) and CSS (for a status SVG image).
version: 1
server:
  port: 8000
  static: static/

monitor:
  dir: monitor.d/

css:
  # Arbitrary metadata can be associated with the four states
  metadata:
    blank:
      color: "white"
    red:
      color: "#fa897b"
    yellow:
      color: "#ffdd94"
    green:
      color: "#d0e6a5"
  rules:
    # Multiple CSS rules with handlebars replacements are supported
    - selectors: "#{{monitor.id}}"
      declarations: "
        background-color: {{monitor.status.css.metadata.color}} !important;
      "
The monitors are configured by creating a subdirectory in the monitor directory (default monitor.d/) and
placing a config.yaml in that monitor subdirectory.
# ID is optional and will be inferred from the directory
id: router-1
test:
  interval: 60s
  timeout: 30s
  command: test.sh
Test scripts
The test scripts are usually pretty simple. Note that the docker container ships with a number of useful utilities,
but you can consider manually installing additional packages (either creating an additional docker container or manually
running alpine's apk tool inside the container) to handle your specific cases.
Ping
Unless you have a particularly lossy connection, a single ping should be enough to test whether a host is up:
#!/bin/bash
set -xeuf -o pipefail
ping -c 1 8.8.8.8
cURL
For hosts with services that may be up or down, you may want to use cURL to test whether the service itself is reachable.
#!/bin/bash
set -xeuf -o pipefail
curl --retry 2 --max-time 5 --connect-timeout 5 http://192.168.1.1:9000
Advanced techniques
Tools such as jq, sed, or awk can be used for more advanced tests (ie: APIs). If needed, ssh can be used to
connect to hosts and remote tests can be executed. snmpwalk and snmpget can also be used to construct tests for
devices that speak SNMP.
Performance
Stylus is very lightweight, both from a processing and memory perspective.
On a Raspberry Pi 1B, Stylus uses less than 1% of CPU while refreshing CSS at a rate of 1/s. On a 2015 MacBook Pro, Stylus uses approximately 0.1% of a single core while actively refreshing.
Stylus uses approxmately 2MB to monitor 15 services on a Raspberry Pi (according to ps_mem).
When not actively monitored, Stylus uses a nearly unmeasurable amount of CPU and is pretty much limited by how heavyweight your test scripts are.
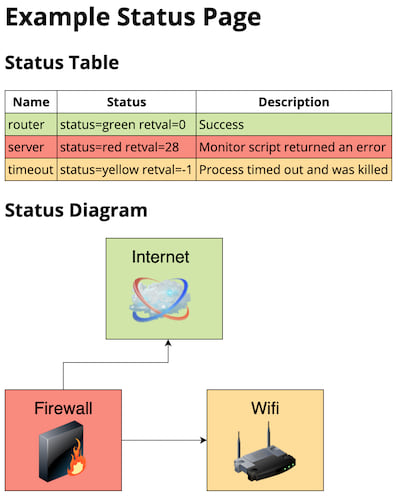
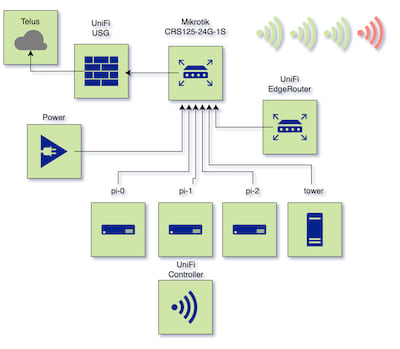
Screenshots
Included example
My personal network
Dependencies
~21–33MB
~528K SLoC