3 releases
Uses old Rust 2015
| 0.7.9 | Oct 27, 2016 |
|---|---|
| 0.7.8 | Sep 28, 2016 |
| 0.7.7 | Sep 28, 2016 |
#329 in Visualization
44KB
1K
SLoC
Simple Chart
This repository contains stuff to represent iterator of (T, T), that is convertable to (f64,f64), as line chart in bmp format.
![]()
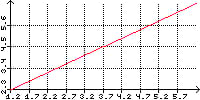
Example 1. One serie and auto calculated axis returned as Vec<u8>:
    let mut chart = Chart::new(200, 100, "#ffffff", "#000000")
        .unwrap();

    let v: Vec<_> = vec![(1.2,2.3), (3.4, 4.5), (5.6, 6.7)];
    let serie = Serie::new(v.into_iter(), "#ff0000").unwrap();
    let series = vec![serie];

    let bmp = chart.draw(series.into_iter());
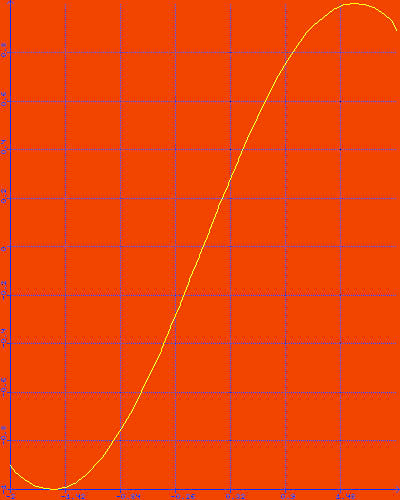
Example 2. One serie, calculated from included macros formula!,
and manual setted axis x:
    let mut chart = Chart::new(400, 500, "#f14500", "#0027ff")
        .unwrap()
        .add_axis_x(Axis::new(-2.0, 2.0, 7, 2));

    let v = formula!(y(x) = x.sin(), x = [-3.14, 3.14; 0.1]);
    let serie = Serie::new(v.into_iter(), "#ffff00").unwrap();
    let series = vec![serie];

    let bmp = chart.draw(series.into_iter());
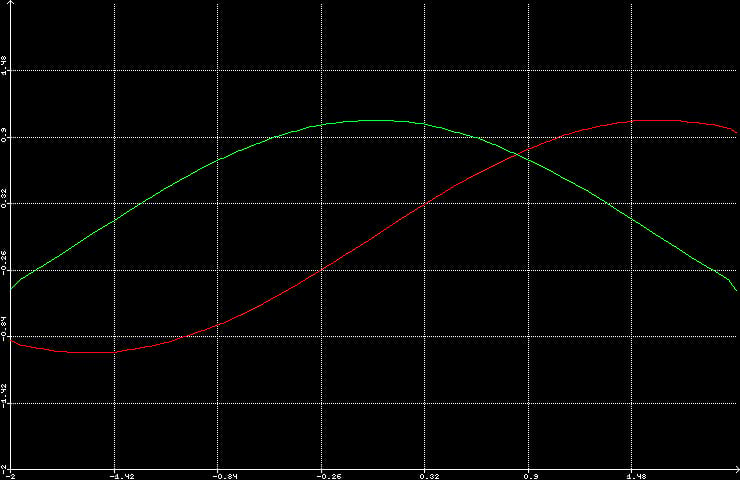
Example 3. Two series and manual setted axis x and y:
    let mut chart = Chart::new(740, 480, "#000000", "#ffffff")
        .unwrap()
        .add_axis_x(Axis::new(-2.0, 2.0, 7, 2))
        .add_axis_y(Axis::new(-2.0, 2.0, 7, 2));

    let v1 = formula!(y(x) = x.sin(), x = [-3.14, 3.14; 0.1]);
    let v2 = formula!(y(x) = x.cos(), x = [-3.14, 3.14; 0.1]);
    let serie1 = Serie::new(v1.into_iter(), "#ff0000").unwrap();
    let serie2 = Serie::new(v2.into_iter(), "#00ff00").unwrap();
    let series = vec![serie1, serie2];

    let bmp = chart.draw(series.into_iter());
Usage
Put this in your Cargo.toml:
[dependencies]
simple-chart = "*"
And this in your crate root:
extern crate simple_chart;
use simple_chart::{Chart, Serie, Axis, Point};
Resources
License
MIT
Dependencies
~0.2–1MB
~23K SLoC