1 unstable release
| 0.0.1 | Jan 27, 2023 |
|---|
#39 in #debugger
37KB
932 lines
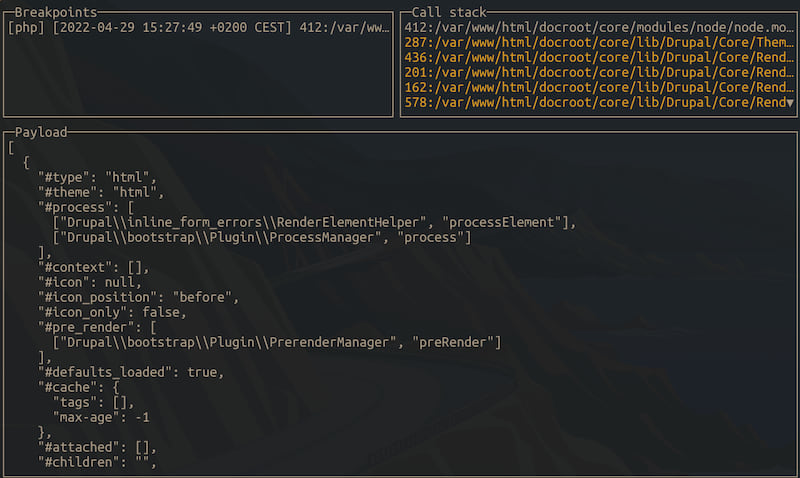
Poor's man debugger
🚧 Under development, it works but some stuff might change in the future.
The most simple way to debug your code.
This is a simple TUI debugger, it starts a local server that accepts payloads from the adapters. Everything goes through HTTP requests, so it's very fast compared to other solutions. You can think of it as a console.log(), but instead of the browser you use the terminal and it works with any language.
Requirements
- PMD-adapter for your language installed in the project.
Installation
You can install it via cargo.
- Install cargo (https://doc.rust-lang.org/cargo/)
- Run
cargo install pmd
Configuration
The default config is located at ~/.config/pmd/config.toml (for UNIX like systems) or ~/.pmd/config.toml (for Windows).
You can override the default config by passing a -c (--config) flag that points to the config.toml file.
Keybindings
Keybindings are VIM-like. The leader key is set by default to , , but you can override this via config.
Debugger consists of three input states
- Normal
- Visual
- Inspection
Normal
Normal mode enables you to scroll all the breakpoints and callstack data.
It has the following keybindings:
j(orDown arrow) -> Move down the listk(orUp arrow) -> Move up the list<leader> + h-> Move to the left<leader> + l-> Move to the righti-> Set inspection mode, to inspect the dumped variablesv-> Set visual mode and open the selected breakpoint/callstack in a popup for more details.q-> Quit
Visual
Visual mode is meant to show additional data that are not present in normal mode for breakpoints/callstack.
It has the following keybindings:
q-> QuitESC-> Go to normal mode
Inspection
Inspection mode enables you to inspect the tree-like data that were sent by the adapters.
It has the following keybindings:
j(orDown arrow) -> Move down the treek(orUp arrow) -> Move up the treeh-> Close the selected iteml-> Expand selected item.q-> QuitESC-> Go to normal mode
Adapters
Adapters are language specific packages that sends the actual debug data to PMD via HTTP.
Currently supported
Adapter API
An example API for an adapter
curl --request POST \
  --url http://localhost:6969/dump \
  --header 'Content-Type: application/json' \
  --data '{
        "timestamp": "3223232",
        "line": "6",
        "connector_type": "php",
        "filepath": "/home/project/drupal/web/index.php",
        "callstack": [
                {
                        "filepath": "/home/project/drupal/web/index.php",
                        "line": "10"
                }
        ],
        "payload": ""
}'
Types:
- timestamp -> String
- line -> String
- connector_type -> String
- filepath -> String
- callstack -> Array (where key is a line number (int), and value is a file path (string)
- payload -> JSON encoded string
Security Vulnerabilities
For any security vulnarabilities please send an email to hey@nkoporec.com
Credits
License
The MIT License (MIT). Please see License File for more information.
Dependencies
~12–22MB
~303K SLoC