4 releases (breaking)
| 0.4.0 | Dec 9, 2024 |
|---|---|
| 0.3.0 | Nov 21, 2024 |
| 0.2.0 | Nov 20, 2024 |
| 0.1.0 | Sep 9, 2024 |
#173 in Debugging
267 downloads per month
16KB
149 lines
Unbug
Debug breakpoint assertions for Rust.
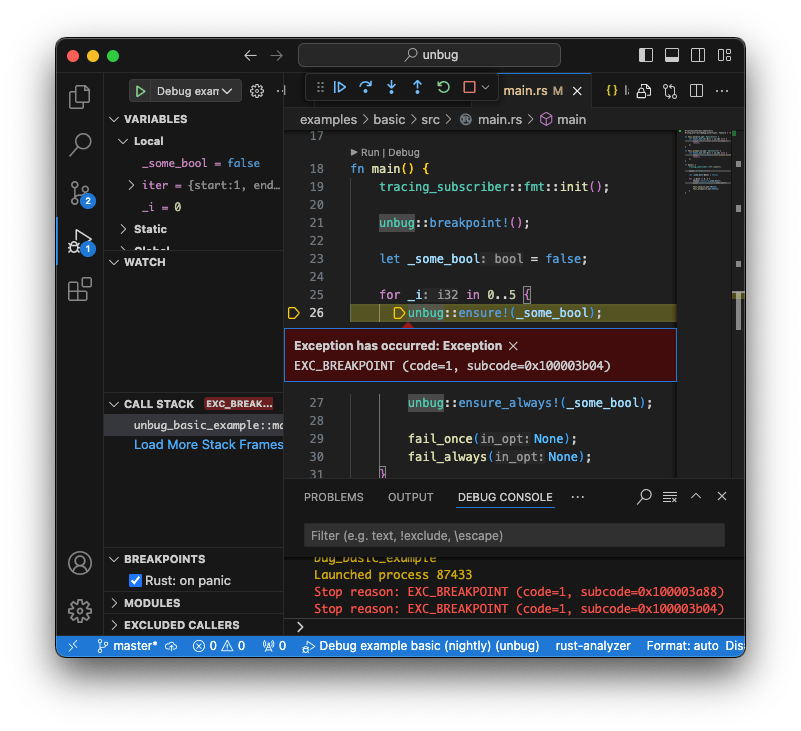
These macros are designed to help developers catch errors during debugging sessions that would otherwise be a panic (which may not be desirable in certain contexts) or simply a log message (which may go unnoticed).
Shims are provided so breakpoints will not be compiled in release builds. This means that the macros in this crate can be used freely throughout your code without having to conditionally compile them out yourself.
NOTICE
Stable Rust is only supported on x86, x86_64, and ARM64.
Other targets require nightly Rust with the
breakpointfeature enabled in your crate (#![feature(breakpoint)]).
Error messages are logged when used in conjuction with Tracing
Examples
// trigger the debugger
unbug::breakpoint!();

// Use the tracing_subscriber crate to enable log messages
tracing_subscriber::fmt::init();

for i in 0..5 {
    // ensure! will only trigger the debugger once
    // when the expression argument is false
    unbug::ensure!(false);
    unbug::ensure!(false, "Ensure can take an optional log message");
    // ensure! messages will not be compiled into release builds
    unbug::ensure!(false, "{}", i);

    // ensure_always! will trigger the debugger every time
    // when the expression argument is false
    unbug::ensure_always!(i % 2 == 0);

    // fail! pauses and logs an error message
    // will also only trigger once
    unbug::fail!("fail! will continue to log in non-debug builds");

    if i < 3 {
        // fail! and fail_always! can be formatted just like error!
        // from the Tracing crate
        unbug::fail!("{}", i);
    }

    let Some(_out_var) = some_option else {
        // fail! and fail_always! will continue to log a message in release builds
        unbug::fail_always!("fail_always! will trigger every time");
    };
}
Usage
Prepare your environment for debugging Rust.
If you are using VSCode you will need the Rust Analyzer and Code LLDB (Linux/Mac) or the C/C++ (Windows) extensions. See Microsoft's Documentation on Rust Debugging in VSCode.
1. Add Unbug to your project's dependencies
Cargo.toml:
[dependencies]
unbug = "0.4"
2. Set up a debug launch configuration
Sample VSCode .vscode/launch.json with LLDB (Linux/Mac):
{
    "version": "0.2.0",
    "configurations": [
        {
            "type": "lldb",
            "request": "launch",
            "name": "LLDB Debug",
            "cargo": {
                "args": [
                    "build",
                    "--bin=my_project",
                    "--package=my_project"
                ],
                "filter": {
                    "name": "my_project",
                    "kind": "bin"
                }
            },
            "args": [],
            "cwd": "${workspaceFolder}",
            "env": {
                "CARGO_MANIFEST_DIR": "${workspaceFolder}"
            }
        }
    ]
}
Sample VSCode .vscode/launch.json with msvc (Windows):
{
    "version": "0.2.0",
    "configurations": [
		{
            "name": "Windows debug",
            "type": "cppvsdbg",
            "request": "launch",
            "program": "${workspaceRoot}/target/debug/unbug_basic_example.exe",
            "stopAtEntry": false,
            "cwd": "${workspaceRoot}",
            "preLaunchTask": "win_build_debug"
        }
    ]
}
and complimentary .vscode/tasks.json
{
	"version": "2.0.0",
	"tasks": [
		{
			"type": "cargo",
			"command": "build",
			"args": [
				"--bin=my_project",
				"--package=my_project"
			],
			"problemMatcher": [
				"$rustc"
			],
			"group": {
				"kind": "build",
				"isDefault": true
			},
			"label": "win_build_debug"
		}
	]
}
3. Select the debug launch configuration for your platform and start debugging
In VSCode, open the "Run and Debug" panel from the left sidebar.
launch configurations can be now found in the dropdown menu next to the green "Start Debugging" button.
When debugging is active, controls for resume execution, step-over, and step-out are at the top of the window under the search field.
If you are not using x86, x86_64, or ARM64
Including, but not limited to WASM, RISCV, PowerPC, and ARM32
You'll need nightly Rust with the breakpoint feature enabled.
To Enable Nightly Rust:
You can set a workspace toolchain override by adding a rust-toolchain.toml file at the root of your project with the following contents:
[toolchain]
channel = "nightly"
OR you can set cargo to default to nightly globally:
rustup install nightly
rustup default nightly
enable the breakpoint feature in the root of your crate (src/main.rs or src/lib.rs):
src/main.rs:
// this configuration will conditionally activate the breakpoint feature only in a dev build
#![cfg_attr(debug_assertions, feature(breakpoint))]
Additonally, debugging may not land on the macro statements themselves. This can have the consequence that the debgger may pause on an internal module. To avoid this, return or continue immediately following a macro invocation. Alternatively, use your debugger's "step-out" feature until you reenter the scope of your code.
Late attach debugging support
By default this crate assumes that the debugger is attached to the process as soon as execution begins. This means that the debugger detection cache is populated when the first breakpoint occurs. If a debugger is not attached before then, Unbug will not fire breakpoints for the rest of that execution session. If you plan on attaching to a process late you can use the no_cache_debugger feature to check for the presence of a debugger every time a breakpoint is called. This will incur a runtime cost which may significantly impact performance on some platforms. To enable this feature add it to Cargo.toml:
[features]
default = ["unbug/no_cache_debugger"]
License
Unbug is free and open source. All code in this repository is dual-licensed under either:
- MIT License (LICENSE-MIT or http://opensource.org/licenses/MIT)
- Apache License, Version 2.0 (LICENSE-APACHE or http://www.apache.org/licenses/LICENSE-2.0)
at your option.
Dependencies
~320–440KB

