3 unstable releases
| 0.2.0 | Jun 15, 2020 |
|---|---|
| 0.1.1 | May 25, 2020 |
| 0.1.0 | May 19, 2020 |
#4 in #scala
17MB
2K
SLoC
panopticon-tui
![]()
![]()
Terminal UI observability and diagnostic tool for Scala applications.
Currently supports:
- ZIO-ZMX
- Slick + HikariCP (over JMX)
- Akka actor metrics (via akka-periscope)
Usage
Prerequisites
You'll need to have java installed (it is loaded dynamically by jmx crate).
Example
There's a complete example of adjusting a real project to work with panopticon. Check it out to see how it's done.
Running Panopticon
To get a binary for your OS check releases page.
Panopticon is published to crates.id, so if you have rust toolchain installed, you can run cargo install panopticon-tui and it will build the executable for you.
You can also build it from sources:
cargo build
./target/debug/panopticon-tui [OPTIONS]
To get a detailed help message, run:
panopticon-tui --help
⚠️ MacOS and libjvm.dylib
On MacOS you can face an error like this:
dyld: Library not loaded: @rpath/libjvm.dylib
  Referenced from: panopticon-tui
  Reason: image not found
It means that j4rs, which is used for JMX integration wasn't able to locate your java installation.
To fix that, just create a symlink to libjvm.dylib (this works for JDK 11 and MacOS 10.15.4):
sudo ln -s $(/usr/libexec/java_home)/lib/server/libjvm.dylib /usr/local/lib
Depending on your MacOS version or java package, location may differ, so make sure to check the symlink is valid.
Connecting to zio-zmx server
ZIO-ZMX is a tool for monitoring ZIO-based apps. With panopticon you can see the fiber tree visualized and monitor their number:
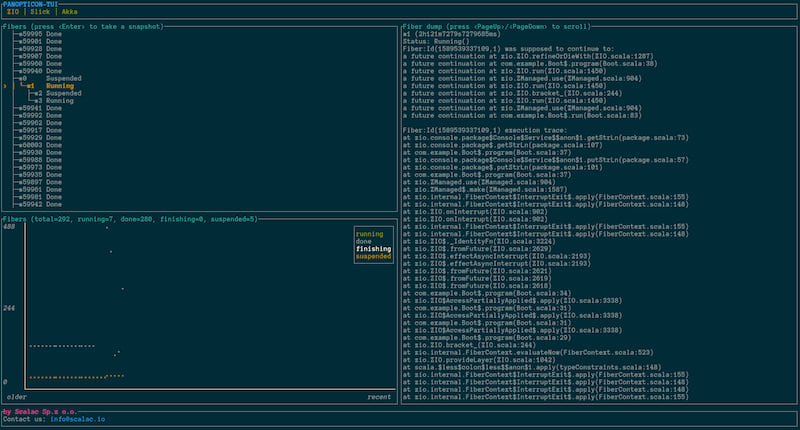
You can specify zio-zmx server address with --zio-zmx option. In this case Panopticon will connect to it and show a ZMX tab:
panopticon-tui --zio-zmx localhost:6789
⚠️ WARNING: Currently, zio-zmx doesn't provide efficient ways of getting fiber count metrics, so Panopticon has to do a full fiber dump each tick to calculate them. Make sure your tick-rate isn't too frequent.
Database metrics over JMX
Panopticon can show database metrics, if your app exposes them via JMX. Slick and HikariCP are the only supported options at the moment.
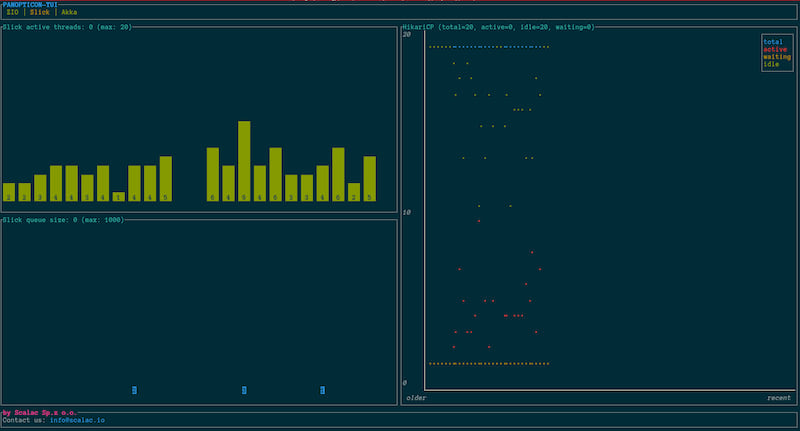
Slick tab will be shown in Panopticon if you specify these two options:
panopticon-tui --jmx localhost:9010 --db-pool-name myDb
Here db-pool-name is a connection pool name, used to qualify JMX beans for Slick and/or HikariCP.
See this section of Slick docs for details about setting up your app to expose db metrics over JMX.
Also keep in mind that you need to specify some JVM parameters on startup so that your app exposes JMX metrics. Something along the following lines:
-Dcom.sun.management.jmxremote
-Dcom.sun.management.jmxremote.port=9010
-Dcom.sun.management.jmxremote.rmi.port=9010
-Dcom.sun.management.jmxremote.local.only=false
-Dcom.sun.management.jmxremote.authenticate=false
-Dcom.sun.management.jmxremote.ssl=false
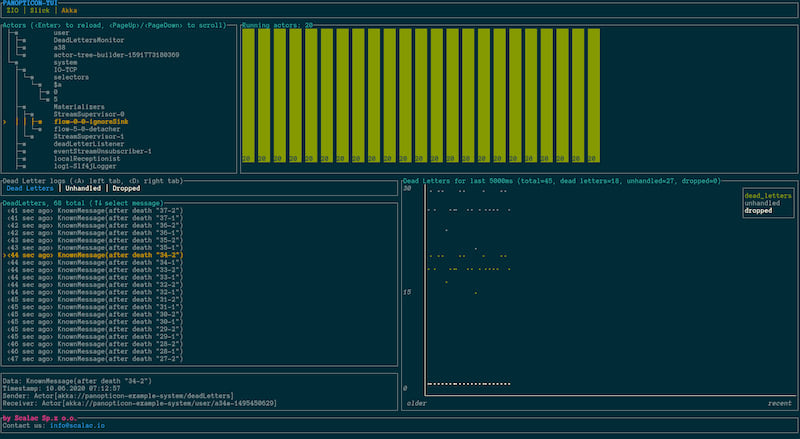
Akka metrics
Panopticon can also do several valuable things for akka-based systems:
- show entire tree of actors under some actor system;
- monitor total amount of actors in real-time;
- show latest messages that went to "dead-letters" queue with details;
- monitor total amount of dead letters in real-time.
To use these features, however, you'd have to enable publication of this data in your application. There's the akka-periscope library, specifically suited for that purpose. Checkout it's README for the details on how you can set it up.
Only HTTP way of transfer is supported for at the moment. To use it and see the actor data on a separate tab, launch Panopticon with following options:
panopticon-tui --actor-tree http://localhost:8080/actor-tree --actor-system-status http://localhost:8080/actor-system-status --dead-letters http://localhost:8080/dead-letters
Replace the endpoint urls with the ones you set up with akka-periscope.
Build from sources
Development build:
cargo build
Optimized release build:
cargo build --release
Dependencies
~21–37MB
~574K SLoC