6 releases
| 0.1.5+0.103.0 | Mar 19, 2025 |
|---|---|
| 0.1.4+0.102.0 | Feb 26, 2025 |
| 0.1.3+0.101.0 | Dec 26, 2024 |
| 0.1.1+0.99.0 | Oct 17, 2024 |
| 0.1.0+0.98.0 | Sep 19, 2024 |
#201 in Visualization
50 downloads per month
Used in nu-jupyter-kernel
70KB
2K
SLoC
nu_plugin_plotters
A nushell plugin for plotting charts.
About
nu_plugin_plotters is a plugin for Nushell that
provides easy plotting of data using
plotters.
Usage
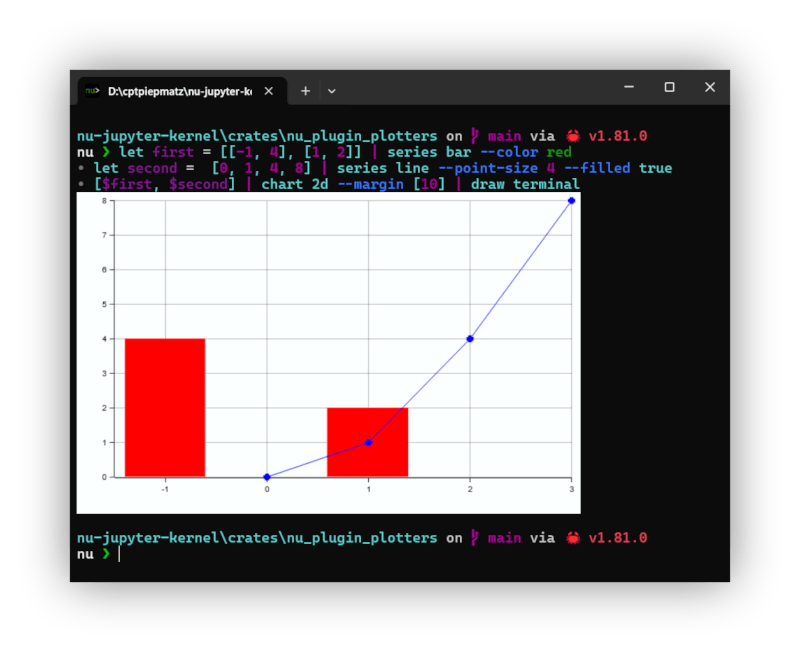
The plugin provides three main commands:
-
series: Use this command to create a dataset from a list of data points. You can pass in:- A table with
xandycolumns. - A list of 2-element lists representing
xandycoordinates. - A plain list of numbers, where the index of each value becomes the
xvalue.
You can also apply custom styling to the series.
- A table with
-
chart: This command creates a chart from one or more series. You can either pipe the series into the command or pass them as arguments. Charts can also be extended by adding more series, and you have options to customize the chart's appearance. -
draw: This renders the chart onto a canvas. You can output to an SVG file (using thesavecommand) or display directly in the terminal (using iterm, kitty or sixel).
These commands are modular, allowing you to build and inspect charts step by step. Each command's output is a custom value that can be converted into standard Nu values for further inspection or manipulation.
nu-jupyter-kernel Integration
This plugin is directly integrated into the
nu-jupyter-kernel and
therefore doesn't need to installed separately in order to create charts for the
notebook.
Also charts are automatically "drawn" and don't need to be called via draw svg.
Just output the chart and the kernel will execute the draw svg command
automatically (you may need to enforce this using nuju display svg).
This plugin is integrated directly into the
nu-jupyter-kernel, so
there's no need for separate installation to create charts within Jupyter
notebooks.
Charts are automatically rendered without the need to explicitly call draw svg.
Simply output the chart, and the kernel will handle the draw svg command
behind the scenes.
If necessary, you can enforce this behavior by using the
nuju display svg command.
Version Scheme
This crate follows the semantic versioning scheme as required by the
Rust documentation.
The version number is represented as x.y.z+a.b.c, where x.y.z is the version
of the crate and a.b.c is the version of the nu-plugin that this crate is
built with.
The + symbol is used to separate the two version numbers.
Dependencies
~31–66MB
~1M SLoC