3 releases
Uses new Rust 2024
| new 0.1.2 | May 12, 2025 |
|---|---|
| 0.1.1 | May 12, 2025 |
| 0.1.0 | May 11, 2025 |
#9 in #dashboard
43 downloads per month
255KB
810 lines
metrics-rs-dashboard-actix
A Rust library for integrating metrics and a visualization dashboard. This crate provides a simple way to set up Prometheus metrics and expose them through an API endpoint, as well as a web dashboard for real-time metrics visualization. Actix is used only for exposing the endpoints and dashboard - you can use this library even if your main application isn't built with Actix.
Features
- Easy integration with any Rust application (Actix currently required for dashboard exposure only)
- Real-time metrics visualization dashboard
- Prometheus metrics endpoint
- Support for custom histogram buckets
- Low overhead metrics collection
- Full compatibility with the
metricsecosystem - No custom recorders, leveraging the existing metrics-prometheus-exporter
Inspiration
This library is inspired by metrics-dashboard-rs but with key differences:
- Does not implement custom recorders
- Uses
metrics-exporter-prometheusinstead ofprometheusdirectly for less overhead - Adds support for histograms with custom buckets
Installation
Add this to your Cargo.toml:
[dependencies]
metrics-actix-dashboard = "0.1.0"
Quick Start
use actix_web::{App, HttpServer};
use metrics::{counter, histogram};
use metrics_actix_dashboard::{create_metrics_actx_scope, DashboardInput};
use metrics_exporter_prometheus::Matcher;

#[actix_web::main]
async fn main() -> std::io::Result<()> {
    // Configure custom histogram buckets (optional)
    let dashboard_input = DashboardInput {
        buckets_for_metrics: vec![(
            Matcher::Prefix("request_latency".to_string()),
            &[10.0, 50.0, 100.0, 200.0, 500.0, 1000.0, 2000.0],
        )],
    };

    // Create your Actix web app with the metrics scope
    // Note: Actix is currently required only for exposing the dashboard and metrics endpoints
    HttpServer::new(|| {
        let metrics_scope = create_metrics_actx_scope(&dashboard_input).unwrap();

        App::new()
            .service(metrics_scope)
            // ... your other routes
    })
    .bind(("127.0.0.1", 8080))?
    .run()
    .await
}
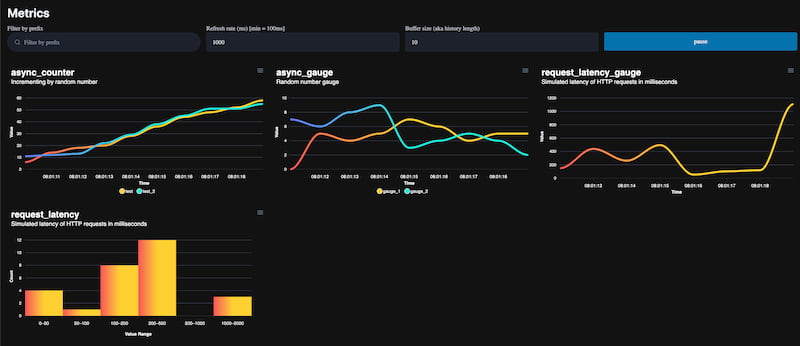
Using the Dashboard
Once your application is running, you can:
- Access the metrics dashboard at:
http://localhost:8080/metrics/dashboard - View Prometheus metrics at:
http://localhost:8080/metrics/prometheus
Note that while you can use the metrics collection functionality in any Rust application, Actix Web is currently required to expose the dashboard and metrics endpoints.
Actix Web Integration
This library uses Actix Web solely for exposing the dashboard and metrics endpoints. You can use the metrics collection functionality in any Rust application, regardless of whether your main application uses Actix or not. However, at this moment, Actix Web is required to expose the dashboard and metrics API endpoints.
Future versions may provide additional integration options for other web frameworks.
Defining Metrics
This library re-exports the metrics crate, so you can use all its functionality:
use metrics_actix_dashboard::metrics::{counter, histogram, gauge};

// Define and use counters
counter!("my_counter").increment(1);

// Define and use histograms
histogram!("request_latency", "milliseconds").record(42.0);

// Define and use gauges
gauge!("active_connections").set(5.0);
Grouoping Counter and Gauge metrics
You can use type label to group counter or gauges into single chart.
describe_gauge!("request_latency");
gauge!("request_latency", "type" => "success").set(42.0);
gauge!("request_latency", "type" => "error").set(100.0);
Custom Histogram Buckets
You can define custom histogram buckets for more precise measurements:
use metrics_actix_dashboard::{DashboardInput, create_metrics_actx_scope};
use metrics_exporter_prometheus::Matcher;

let dashboard_input = DashboardInput {
    buckets_for_metrics: vec![
        // Custom buckets for request latency
        (
            Matcher::Prefix("request_latency".to_string()),
            &[10.0, 50.0, 100.0, 200.0, 500.0, 1000.0, 2000.0],
        ),
        // Custom buckets for another metric
        (
            Matcher::Exact("database_query_time".to_string()),
            &[0.001, 0.005, 0.01, 0.05, 0.1, 0.5, 1.0],
        ),
    ],
};

let metrics_scope = create_metrics_actx_scope(&dashboard_input).unwrap();
Documentation
For more examples and detailed documentation, check out the example code.
License
This project is licensed under the MIT License.
Dependencies
~25–40MB
~664K SLoC