3 releases
| 0.1.2 | Dec 9, 2021 |
|---|---|
| 0.1.1 | Feb 1, 2021 |
| 0.1.0 | Jan 30, 2021 |
#1 in #c3
26KB
361 lines
mdbook-chart
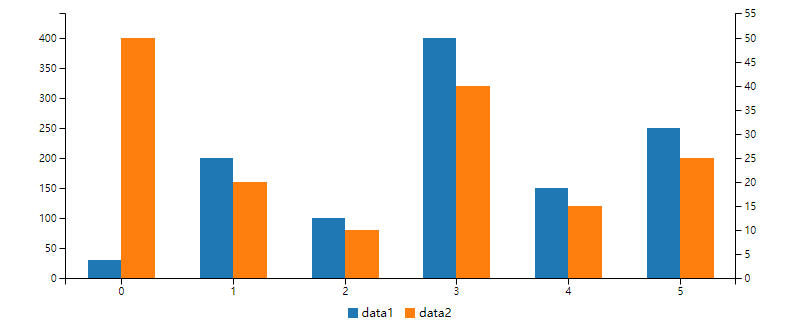
A preprocessor and cli tool for mdbook to show chart use C3.js.
install
cargo install mdbook-chart
1. Use as mdbook preprocessor.
#cat /path/to/your/mdbook/book.toml

[book]
authors = []
language = "en"
multilingual = false
src = "src"

[build]
create-missing = false

#use as mdbook preprocessor
[preprocessor.chart]

[output.html]
additional-js = ["assets/d3/d3.min.js", "assets/c3/c3.min.js"]
additional-css = ["assets/c3/c3.min.css"]

[output.html.fold]
enable = true
level = 0
2. edit your markdown file
```chart
{
    "data": {
        "type": "bar",
        "columns": [
            ["data1", 30, 200, 100, 400, 150, 250],
            ["data2", 50, 20, 10, 40, 15, 25]
        ],
        "axes": {
            "data2": "y2"
        }
    },
    "axis": {
        "y2": {
            "show": true
        }
    }
}
```

or

{% chart %}
{
    "data": {
        "type": "foo",
        "columns": [
            ["data1", 30, 200, 100, 400, 150, 250],
        ["data2", 50, 20, 10, 40, 15, 25]
        ],
        "axes": {
            "data2": "y2"
        }
    },
    "axis": {
        "y2": {
            "show": true
        }
    }
}
{% endchart %}
When you run
mdbook serve
Or
mdbook build
this will do something to make sure your chart show as you wish.

Dependencies
~14–25MB
~389K SLoC