1 unstable release
| 0.1.0 | Nov 24, 2019 |
|---|
#303 in Visualization
77KB
2K
SLoC

Live timeseries analysis on your desktop!
About
Lognplot is a graphical viewer for time series data. Unlike many other projects in this area, lognplot is not a hosted web application. It is a desktop application which visualizes your data from your application. This can be an embedded, robotic, mobile, PC or PLC application.
Features:
- Plot data live while staying responsive
- Send data over TCP/IP link to GUI.
- Two GUI implementations:
- python GUI implementation (based on PyQt5)
- rust GUI implementation (based on gtk-rs / cairo)
- Client libraries for:
- Export data to HDF5
- Data adapters for:
- ADS
- MQTT
- ROS2
Video
These are recorded videos of the tool:
Screenshots
This is an example screenshot of the lognplot python application, visualizing 10 million datapoints. Note that zooming is still smoothly performed.

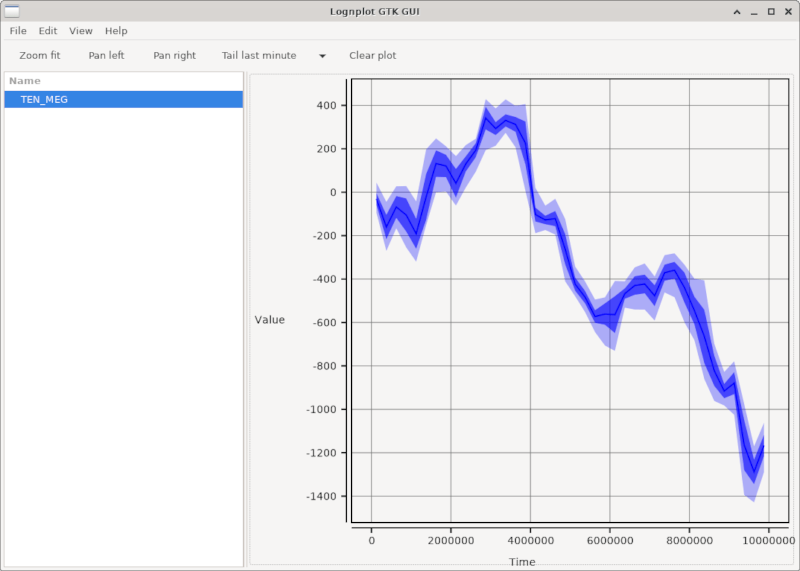
This is an example screenshot of the GTK gui implemented with rust, visualizing also 10 million datapoints.

This is an example of the plot window, when zoomed out. Note that not all points are displayed, but aggregates of the data are visualized as min/max/mean/stddev lines.

When zooming into the data, the individual data points come into picture.

Installation
Note that at this moment, you will want to grab the latest git version from github.
First clone this repository:
$ git clone https://github.com/windelbouwman/lognplot.git
For python, follow this steps:
$ cd lognplot/python
$ pip install .
$ python -m lognplot
For rust, follow these steps:
$ cd lognplotgtk
$ cargo run --release
Packages are released for rust and python
Rust crate: https://crates.io/crates/lognplot
Python package: https://pypi.org/project/lognplot/
Requirements
For the GTK variant of the tool, you need the following to be installed:
- cairo-gobject-devel
- pango-devel
- atk-devel
- gdk-pixbuf2-devel
- gtk3-devel
- hdf5-devel
Usage
To use the python side of this code, start as a demo the softscope:
$ cd python
$ python softscope.py
This will popup a plot window. Zooming and panning can be done with the keyboard keys w,a,s,d and i,j,k,l. Press space or enter to autofit. The data is a 10 kHz generated signal.
Another demo is the softscope server. This will open a TCP/IP port which can receive data.
$ cd python
$ python -m lognplot
The softscope is now ready to receive streaming data via network.
Next, start the demo datasource, which will send data via TCP to this GUI:
$ cd demo
$ python noize_source.py
Another server demo is the rust side of the code. Start the GUI like this:
$ cd lognplotgtk
$ cargo run
This application will be able to receive data via TCP/IP.
Send data from C code
To send data from C-code, refer to the demo in demo/c. This demo uses
the clognplot rust crate, which is a static library which can be used from C.
The resulting C program will connect over TCP/IP and send its data to the plot
tool using parts of the rust crates.
Export data to HDF5
To be able to further process the data in, for example, a python script, you can use File->Save to save all captured data as a HDF5 file.
Example usage of this saved HDF5 file:
import h5py
from matplotlib import pyplot as plt

f = h5py.File('datorz.h5', 'r')
group = f['my_datorz']
signal = group['My_signal']
plt.plot(signal[:,0], signal[:,1])
plt.show()
Documentation
Documentation for python users can be found here: https://lognplot.readthedocs.io/en/latest/ Documentation for rust users can be found here: https://docs.rs/lognplot
Plan
This is a list of things to do:
- PyQt5 implementation
- gtk-rs implementation
Requirements for live data visualization
- Append data structure to enable appending new data
- Data point aggregation for zooming out and showing min/max/mean lines
Similar projects
There is an interesting list of similar projects. Do you know of another project? Please submit a pull request or an issue!
- Embedded debugger
- getcurve.io
- grafana
- Web based
- KST plot
- Can view large CSV files
- plot juggler
- Qt interface
- Interfaces with ROS
- Plc-Lab
- Fancy GUI
- RQT
- Comes with ROS
- sigrok
- Slick Qt interface
- Interfacing with many logic analyzers and oscilloscopes
- speedscope
- Callstack tracer
- trace compass
- Eclipse based
- Supports many trace formats
- tracy profiler
Profiling
To optimize the GUI experience, you can profile the rust lognplot gui by the following method.
Modify the Cargo.toml file to include this snippet:
[profile.release]
debug = true
This will build in release mode, but include debug symbols.
Now, build in release mode:
$ cargo build --release
Next up, use the linux perf tool to profile the application:
$ perf record -F 99 --call-graph dwarf target/release/lognplotgtk
Now perform some intensive work. When done, close the gui.
Analyze the perf results:
$ perf report
lib.rs:
Log and plot library.
This library serves the purpose of logging data from a system, and plotting the data at the same time.
This can be handy when debugging a system under test.
Dependencies
~0–1.5MB
~23K SLoC