6 releases
| 0.2.1 | Jul 8, 2024 |
|---|---|
| 0.2.0 | Jul 8, 2024 |
| 0.1.3 | Jul 6, 2024 |
#144 in Visualization
45 downloads per month
86KB
519 lines
JONSWAP
Lib and CLI to calculate JONSWAP wave spectrum and its realisation in time domain.
Use:
  jonswap hs tp [-n nharms] [-g gamma] [-s seed] [-d duration] [-t timestep] [-p{s|t}] [-h]
where:
  hs      : significant wave height in meters.
  tp      : spectral peak period in seconds
  -n      : number of harmonics used to discretise the spectrum. Default 200.
  -g      : value for gamma. Default as per DNV.
  -s      : seed number for phase randomisation.
  -d      : duration - timetrace will be shown. Default 120s.
  -t      : time step. Default is 0.1 seconds.
  -p{s|t} : gnuplot friendly output of spectrum (-ps) or timetrace (-pt),
            to be piped to `gnuplot -p -e "plot '-' using i:j w l"` where
            `i:j` are the index of the columns to be used as x and y axis.
            Note this only works for 1 plot. For multiple plots, need to
            save the output to a temporary file.
  -h      : show this help.
Example
Spectrum and a time realisation of a Hs 2.5m, Tp 7s, using default parameters, ie, 200 harmonics and gamma calculated as per DNV.
$ jonswap 2.5 7
Wave Hs            :     2.50 m
Wave Tp            :     7.00 s
Wave Gamma         :    1.932 -
Spectral moment m0 :   0.3897 m²
Spectral moment m2 :   0.5635 m²(rd/s)²
Spectral moment m4 :   2.5620 m²(rd/s)^4
Hm0                :   2.4970 m

Spectrum
========
         T          w           PM           JS          amp        phi
       [s]     [rd/s]     [m²s/rd]     [m²s/rd]          [m]       [rd]
    20.000   0.314159   0.00000000   0.00000000      0.00000    1.61987
    19.633   0.320037   0.00000000   0.00000000      0.00000   -0.30448
    ...
     0.500  12.566371   0.00000405   0.00000328      0.00000   -1.51897

Time History
============
     Time    Elevation
     0.000   0.697963
     0.100   0.734472
     0.200   0.748701
     ...
     119.900  -1.200554
     120.000  -1.180046
Simple plot
The spectrum can be plotted to terminal using GNUPLOT:
$jonswap 2.5 7 -ps | gnuplot -p -e "set terminal dumb; plot '-' using 1:4 w l"

    1 +--------------------------------------------------------------------+
      |      +      +      +  *   +      +     +      +      +      +      |
  0.9 |-+                    * *                     '-' using 1:4 *******-|
      |                      * *                                           |
  0.8 |-+                    *  *                                        +-|
      |                     *   *                                          |
  0.7 |-+                   *   *                                        +-|
      |                     *   *                                          |
  0.6 |-+                  *     *                                       +-|
      |                    *     *                                         |
  0.5 |-+                  *     *                                       +-|
      |                   **      *                                        |
  0.4 |-+                 *       *                                      +-|
      |                  **        *                                       |
  0.3 |-+               **         *                                     +-|
      |                **           **                                     |
  0.2 |-+             **             *                                   +-|
      |              **               *                                    |
  0.1 |-+          ***                 *                                 +-|
      |      +  ****+      +      +     ***    +      +      +      +      |
    0 +--------------------------------------------------------------------+
      0      2      4      6      8      10    12     14     16     18     20
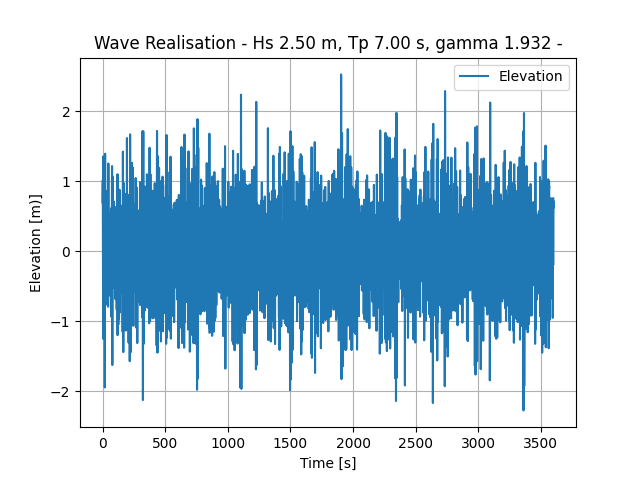
By removing the line set terminal dumb; you can get proper plots. Or, if you
want more control over the plot, there's a convenience Python script plt.py
which generates images like these:

Dependencies
~325KB