7 releases
| new 0.2.5 | May 13, 2025 |
|---|---|
| 0.2.4 | May 13, 2025 |
| 0.2.2 | Aug 30, 2023 |
| 0.1.0 | Aug 27, 2023 |
#60 in Science
143 downloads per month
100KB
704 lines
git-shining: Transform the GitHub contributor graph into living art
This program turns your contributor graph into a work of art by filing commits with the right dates. GitHub will automatically scan the repository and fill out the graph for you.
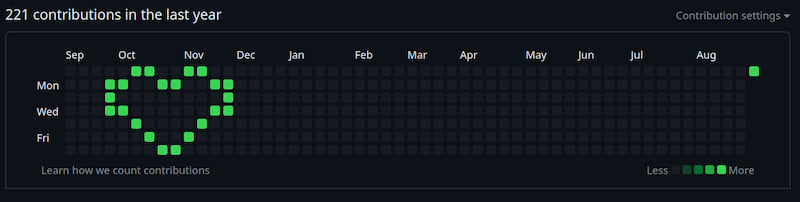

Or here if you want a more in-your-face example.
Constraints
Best to create or use a burner account for this; this is not for your main account.
- You must have no other activity for the year, which includes pull requests, issue comments, etc.
- You must only have one repository recording commits for the year, and it must be all commits related to your message.
- GitHub will let you back-date your commits to 1970/1/1 so be sure to use the
--originoption if you want to exploit that.
Usage
The first step is to generate configuration. You can do this in two ways:
git-shining generate-config <json|txt>
This will generate a blank canvas for editing in JSON or TXT (more on this later) format.
or
git-shining render-font <.otf or .ttf file> <message (be sure to quote)>
This will generate a pre-filled configuration with the message rasterized to the canvas in the font provided.
Then, you can generate a repository with the generate-repository command. Be sure to at least set the email field of the person you want getting credit for the commits, it must map directly to a configured GitHub email:
git-shining generate-repository -i bro.txt -e wearelegion@example.org -m "Sup Bro" /tmp/test.git
After that, you can create your repository and upload it.
If you want to generate repositories that start the graph at a certain date, look at the --origin options of build and generate-repository.
Configuration Formats and Usage
There are two formats for configuration: JSON and TXT.
JSON is a JSON array of integers, from 0-10, which coordinate to shading in the graph (made possible by filing more commits for brighter shades). It is easy to consume, post-process, and generate, but a little hard to edit.
TXT is an easier format to hand-edit. It is simply a well-aligned grid of integers, which you can set from 0-A (A is 10 here) to affect shading.
The generate-config sub-command can generate both formats for hand-editing, and the render-font command has switches to modify target configuration output.
For example, here's the JSON format generated from:
git-shining render-font RobotoCondensed-Varablefont_wght.ttf "I Love You" >out.json
[
0,0,0,0,0,0,0,0,0,0,0,0,0,0,0,0,0,0,0,0,0,0,0,0,0,0,0,0,0,0,0,0,0,0,0,0,0,0,0,0,0,0,0,0,0,0,0,0,0,0,0,0,0,
0,6,0,0,0,0,5,1,0,0,0,0,0,0,0,0,0,0,0,0,0,0,0,0,0,0,0,0,0,6,1,0,0,6,0,0,0,0,0,0,0,0,0,0,0,0,0,0,0,0,0,0,0,
1,8,0,0,0,0,8,1,0,0,0,1,4,4,4,0,2,3,0,2,2,0,4,4,5,0,0,0,0,2,7,0,7,2,0,1,4,4,4,0,1,4,0,1,4,0,0,0,0,0,0,0,0,
1,8,0,0,0,0,8,1,0,0,0,7,1,0,4,5,0,8,0,7,0,4,8,3,5,5,0,0,0,0,3,8,4,0,0,8,0,0,5,4,2,7,0,2,6,0,0,0,0,0,0,0,0,
1,8,0,0,0,0,8,1,0,0,0,7,2,0,4,5,0,4,7,4,0,4,6,1,1,1,0,0,0,0,0,9,0,0,0,8,1,0,5,4,2,7,0,5,8,0,0,0,0,0,0,0,0,
0,4,0,0,0,0,4,5,4,4,1,0,4,4,4,0,0,0,7,0,0,0,4,4,4,1,0,0,0,0,0,5,0,0,0,1,4,4,3,0,0,4,4,4,3,0,0,0,0,0,0,0,0,
0,0,0,0,0,0,0,0,0,0,0,0,0,0,0,0,0,0,0,0,0,0,0,0,0,0,0,0,0,0,0,0,0,0,0,0,0,0,0,0,0,0,0,0,0,0,0,0,0,0,0,0,0
]
This can then be used with the build subcommand to generate a test grid:
git-shining build out.json >out.html
It looks like this:
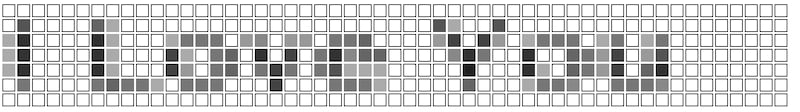
After that, you can confirm it looks the way you want (try different fonts) and lands on the right dates. Use the origin (-o) option to modify it, hover over each pixel to see what date it lands on.
Finally, we can generate our repository and upload it:
git-shining generate-repository -i out.json -e goodmorning@example.org -m "What a happy day" /tmp/love.git
GIT_DIR=/tmp/love.git git remote add origin https://my/git/repository
GIT_DIR=/tmp/love.git git push origin main -u
# optional, as you don't need it anymore
rm -rf /tmp/love.git
Troubleshooting
- If you upload twice, you must fully delete the old repository and re-create it. Force pushes will not clear the graph.
- If you're wondering what your graph will look like before you push to GitHub, try the
buildsub-command which will generate a HTML mock of the graph you can load into your browser. You can hover over each square to get the expected date.
Future Plans
- Marquee and Mural functionality
Author
The Professional erik+github@hollensbe.org
Dependencies
~16MB
~332K SLoC