3 releases (breaking)
| 0.3.0 | Oct 9, 2024 |
|---|---|
| 0.2.0 | Oct 4, 2024 |
| 0.1.0 | Sep 30, 2024 |
#561 in Machine learning
19KB
511 lines
Egg Stats
About
This project makes it easy to visualize statistics about your egg runs. There are two components: egg-stats and egg-viz.
egg-stats is a library that adds a LoggingRunner that can wrap any existing egg::Runner and records customizable statistics to a csv file.
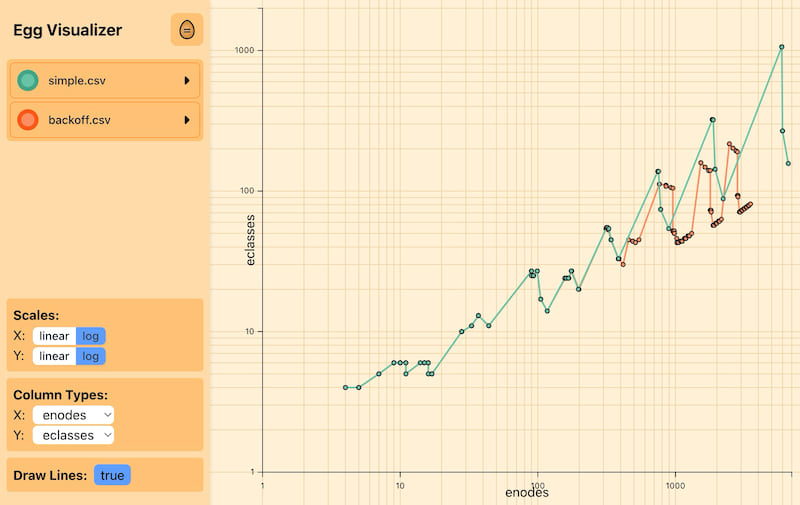
egg-viz is a web interface that let's you view the generated csv files to quickly explore these statistics. The web interface is still in development, and any feedback would be very useful.
Installation
You can add the egg-stats library to your project with:
cargo add egg-stats
You can install the visualizer with:
cargo install egg-viz
Usage
Generating data
LoggingScheduler is the key data-structure. Simply set it as the scheduler of your runner to generate data. You can wrap any other other egg::RewriteScheduler, and it will use it to actually schedule rule applications.
You need to set out_file to an open file, and set logging_enabled to true to see any data. There are a set of provided recorders to record common statistics. You can also easily implement your own. See the docs for more information.
Here is what an example looks like:
Runner::default()
        .with_scheduler(
            LoggingScheduler::from(scheduler)
                .with_out_file(
                    OpenOptions::new()
                        .write(true)
                        .create(true)
                        .truncate(true)
                        .open(path.as_ref())
                        .unwrap(),
                )
                .with_logging_enabled(true)
                .with_recorder(recorders::Timestamp::new(Instant::now()))
                .with_recorder(recorders::NumberENodes)
                .with_recorder(recorders::NumberEClasses)
                .with_recorder(recorders::BestProgram::new(AstSize, root)),
        );
Checkout examples for more complete examples.
Visualizing data
Simply run the following command to open the web interface, passing in the directory where your .csv files are located.
egg-viz <csv data dir>
Dependencies
~2–2.8MB
~51K SLoC
