5 releases
| 0.1.7 | Jan 6, 2025 |
|---|---|
| 0.1.6 | Jan 6, 2025 |
#155 in Visualization
235KB
4.5K
SLoC
DataViz 🚀
A modular, customizable, and feature-rich 2D plotting library written in Rust. With DataViz, you can create a wide variety of plots tailored to your needs, supporting both raster (PNG) and vector (SVG) outputs. You can save and display(interactive or real-time) your DataViz figures.
Features
Supported Plot Types
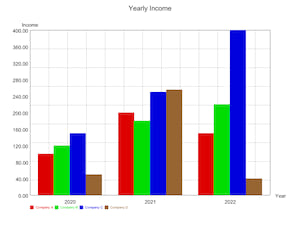
- Bar Charts: Create grouped horizontal and vertical bar charts.
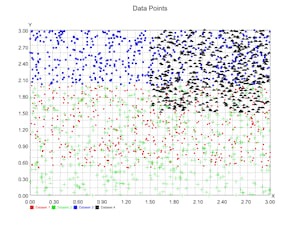
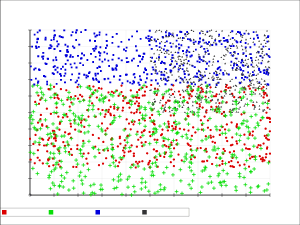
- Scatter Graphs: Visualize data points with various shapes (circle, square, triangle, etc.).
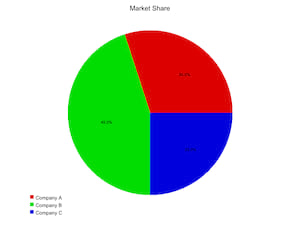
- Pie Charts: Represent data proportions as slices of a circle.
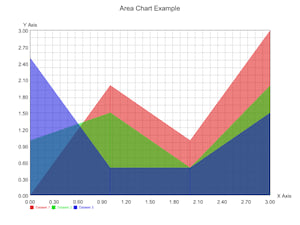
- Area Charts: Highlight trends with filled areas under data lines.
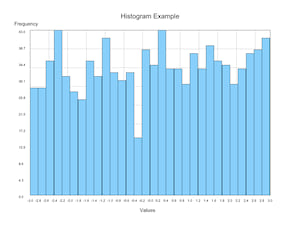
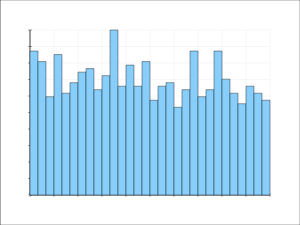
- Histograms: Analyze frequency distributions with dynamic bin calculations.
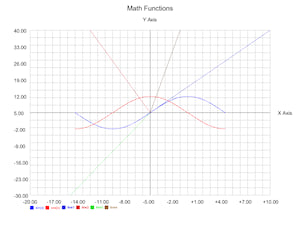
- Cartesian Graphs: Plot mathematical functions or datasets on a coordinate plane.
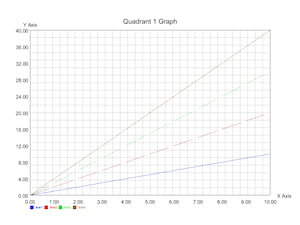
- Quadrant 1 Graphs: Focused plotting in the first quadrant for non-negative data.
Customization Options
- Title: Add meaningful titles to your plots.
- Axes Labels: Define X-axis and Y-axis labels.
- Dynamic Scaling: Automatically fit data within the plot dimensions.
- Colors: Customize colors for the background, axes, and data elements.
- Margins: Add space around the plot for better visibility.
- Line and Dot Styles: Customize line types (solid, dashed, dotted) and dot shapes (circle, square, cross, triangle).
Output Formats
- Raster (PNG): Save high-quality images of your plots.
- Vector (SVG): Generate scalable vector graphics for precision and scalability.
Interactive Capabilities
- Hover effects(Press C key to see it) and real-time updates.
Installation
Add the following dependencies to your Cargo.toml file:
[dependencies]
dataviz = "0.1.6"
Examples
To see more examples you can visit: https://github.com/dataviz-rs/dataviz-examples
Usage Example
🔗 Grouped Vertical Bar Chart Interactive Display Example Code
🔗 Grouped Vertical Bar Chart Implementatiton Using Figure Factory Source Code
🔗 Pixel Area Chart Real Time Display Example Code
🔗 Pixel Cartesian Graph Real Time Display Example Code
🔗 Pixel Histogram Real Time Display Example Code
🔗 Pixel Pie Chart Real Time Display Example Code
🔗 Pixel Quadrant 1 Graph Real Time Display Example Code
🔗 Pixel Scatter Graph Real Time Display Example Code
🔗 SVG Cartesian Graph Example Code
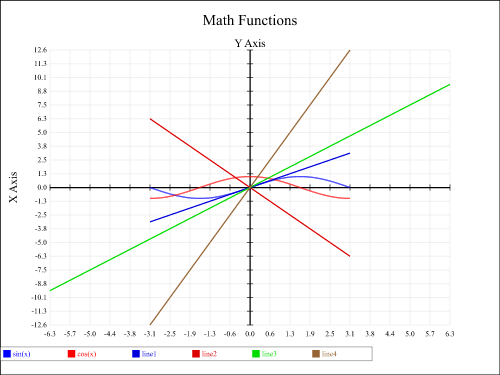
More Examples
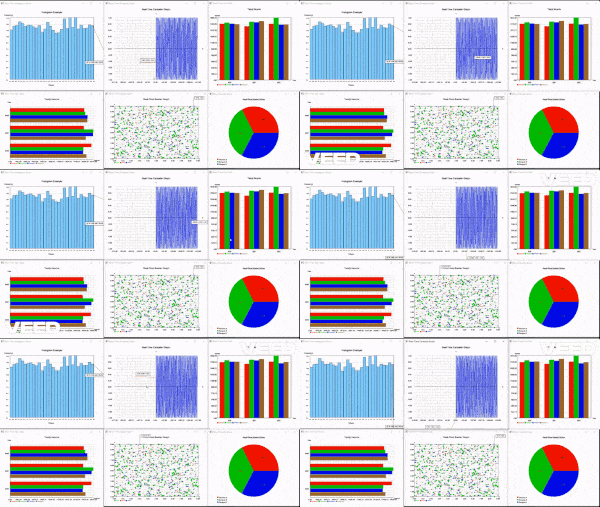
PNG Outputs

SVG Outputs


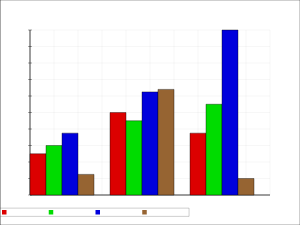
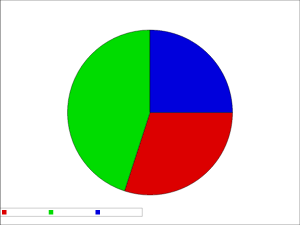
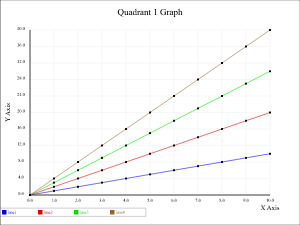

License
This project is licensed under the MIT. See the LICENSE file for details.
Contributing
We welcome contributions to make DataViz even better!
- Visit DataViz repository: https://github.com/dataviz-rs/dataviz
- Report bugs and suggest features through GitHub Issues.
- Submit pull requests for enhancements or fixes.
Let’s make data visualization in Rust easy and accessible!
Dependencies
~17MB
~331K SLoC