3 releases
| 0.6.2 | Feb 19, 2023 |
|---|---|
| 0.6.1 | Feb 18, 2023 |
| 0.6.0 | Feb 18, 2023 |
#2385 in Math
260KB
3.5K
SLoC
corries
CORrosive RIEmann Solver (corrosive because it's written in Rust...) for 1d hydrodynamics problems specialising, planned to be specialised for non-relativistic astrophysics.
Documentation: https://docs.rs/corries/
What does this thing do?
This library allows one to write setups for hydrodynamics simulations, and then let those simulations run. Since this library is supposed to be used for long-running simulations, depending on the setup running for days or weeks, many of the optimisations happen at compile time. This means that even your parameter studies should be setup such that the parameter study runs from a single executable, either by passing the parameters over the command line, or backing the study's parameter space into the main function.
The things Corries can simulate are fairly limited at the time as it only feature cartesian meshes and no source terms. You can check the TODO section for what's coming up, if you know what those terms mean.
The plan with this library is to:
- add at least two more numerical flux solvers (a Kurganov-Tadmor solver, as well as a simple finite differences solver)
- add equation systems with additional momentum components (at least 2D)
- Note that Corries still stays 1D even with those 2D systems, as they assume symmetry along their axes; for example in a disk we would resolve the radius, but assume rotational symmetry
- add non-cartesian symmetry, most notable cylindrical and logcylindrical meshes
- add capabilities for source terms like gravity and viscosity
- add more time integration schemes
Tests
Apart from unit tests, Corries also has a couple of integration tests, which are standard hydrodynamics problems to test that the solver runs like it's supposed to.
The whole test suite can be run with cargo test.
Note for all the plots below
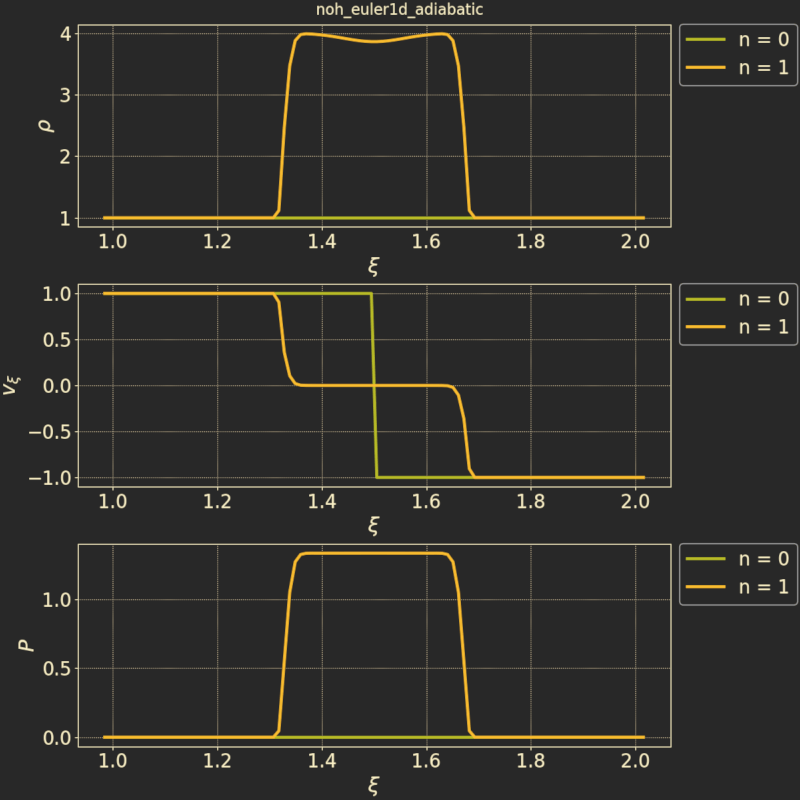
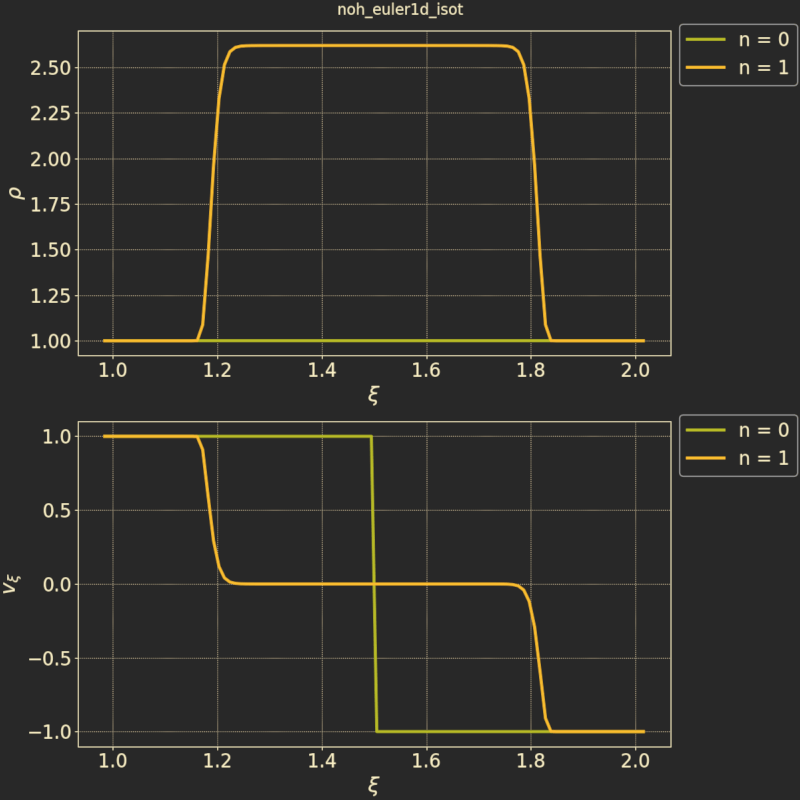
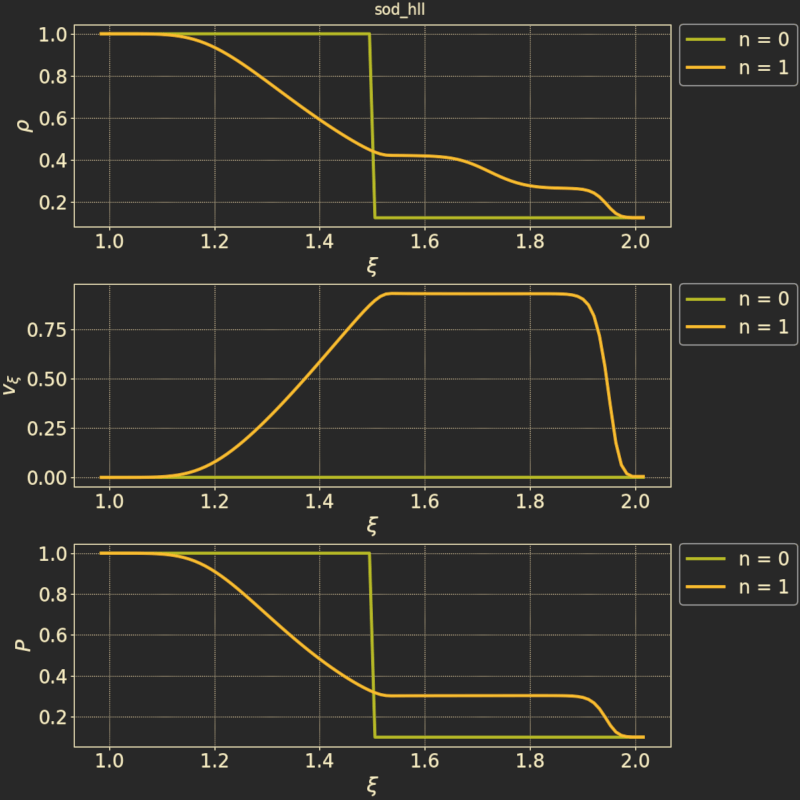
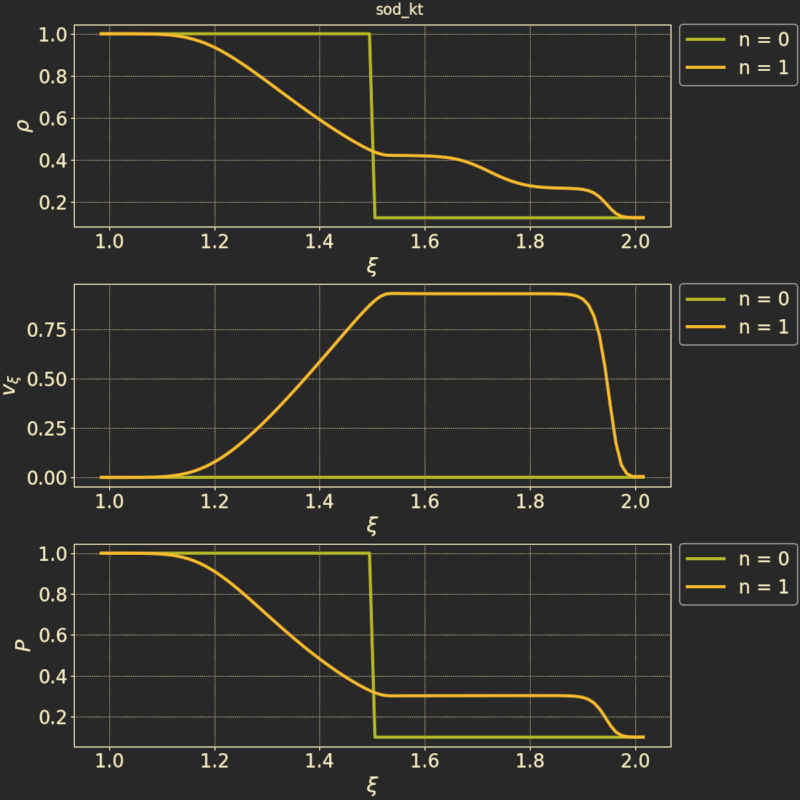
Below you can see a couple of plots for the integration tests. Note that the single spatial coordinate is called ξ, and that the units in the different plots are arbitrary / dimensionless. Most plots show both the initial initial condition (n = 0), and then one or several states, though most will only show the final state of the test.
Many tests are performed using both isothermal and adiabatic systems. This means that in the former we do not explicitly solve for changes in inner energy/pressure. There we assume that temperature and speed of sound are constant throughout the simulation.
The values being plotted are usually the mass density $ρ$, the pressure $P$, and velocities $v_\xi$ and $v_\eta$. Isothermal simulations will not feature the pressure, and simulations with only a single non-vanishing velocity component will drop the second velocity $v_\eta$.
Noh
The Noh test is a classic test modelling a shock tube, where the initial conditions are as follows:
- the mass density (and pressure in the adiabatic case) is the same throughout the tube
- the velocity field is pointing towards horizontal center of the tube with a sharp jump in that center
Here we see the adiabatic case:

And this is the isothermal case:

Note that, in the initial state, the velocity has a sharp jump. As the simulation progresses, we see the fluid bunching up in the middle as more and more material streams in from the boundaries on the sides.
Sod
The Sod test is another standard test modelling a shock tube. In this case, the initial conditions are:
- The fluid is still throughout the tube
- There is a density and pressure shock at the horizontal centre of the tube
This test is going to be used to test different numerical flux schemes. Here is a plot of the test run using the HLL scheme with 0-order reconstruction:

And this is the simulation run with the KT (Kurganov-Tadmor) numerical flux scheme using linear reconstruction:

Licensing
Copyright ©
2022-2023,Tommy BresleinAll rights reserved.
Redistribution and use in source and binary forms, with or without modification, are permitted provided that the following conditions are met:
- Redistributions of source code must retain the above copyright notice, this list of conditions and the following disclaimer.
- Redistributions in binary form must reproduce the above copyright notice, this list of conditions and the following disclaimer in the documentation and/or other materials provided with the distribution.
- Neither the name of the copyright holder nor the names of its contributors may be used to endorse or promote products derived from this software without specific prior written permission.
THIS SOFTWARE IS PROVIDED BY THE COPYRIGHT HOLDERS AND CONTRIBUTORS “AS IS” AND ANY EXPRESS OR IMPLIED WARRANTIES, INCLUDING, BUT NOT LIMITED TO, THE IMPLIED WARRANTIES OF MERCHANTABILITY AND FITNESS FOR A PARTICULAR PURPOSE ARE DISCLAIMED. IN NO EVENT SHALL THE COPYRIGHT HOLDER BE LIABLE FOR ANY DIRECT, INDIRECT, INCIDENTAL, SPECIAL, EXEMPLARY, OR CONSEQUENTIAL DAMAGES (INCLUDING, BUT NOT LIMITED TO, PROCUREMENT OF SUBSTITUTE GOODS OR SERVICES; LOSS OF USE, DATA, OR PROFITS; OR BUSINESS INTERRUPTION) HOWEVER CAUSED AND ON ANY THEORY OF LIABILITY, WHETHER IN CONTRACT, STRICT LIABILITY, OR TORT (INCLUDING NEGLIGENCE OR OTHERWISE) ARISING IN ANY WAY OUT OF THE USE OF THIS SOFTWARE, EVEN IF ADVISED OF THE POSSIBILITY OF SUCH DAMAGE.
Dependencies
~6–14MB
~178K SLoC