7 releases
| 0.0.8 | Nov 13, 2020 |
|---|---|
| 0.0.7 | Nov 7, 2020 |
| 0.0.1 | Oct 31, 2020 |
#707 in Concurrency
58KB
423 lines
Overview
A small utility to benchmark different approaches for building concurrent applications.
Pre-requisites
cargo- https://www.rust-lang.org/tools/installpython3.6+withmatplotlib
It generates the following files in the current directory:
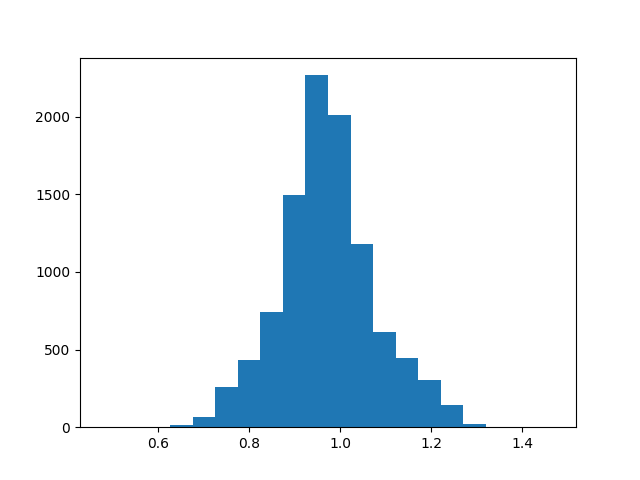
latency_histogram_{name}.png- X-axis latency in ms, Y-axis - counts for buckets
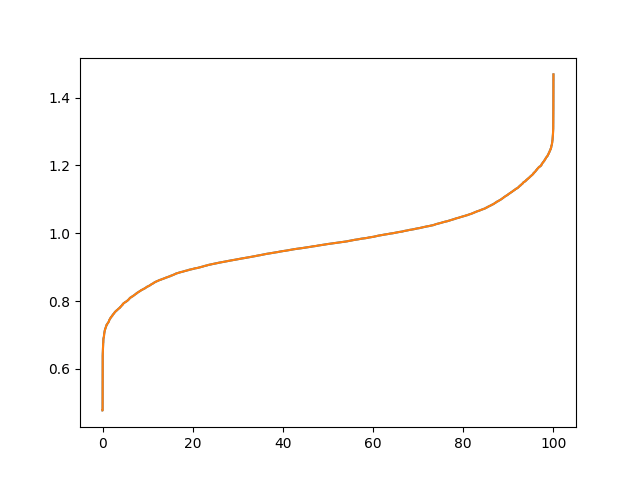
latency_percentiles_{name}.png- X-axis - 0..100. Y-axis - latency percentile in ms
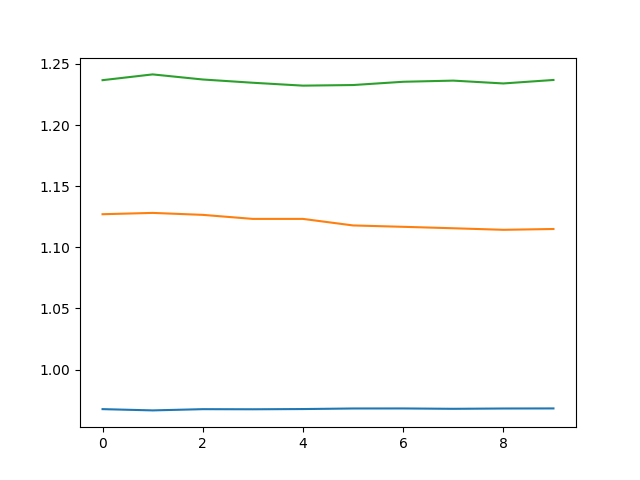
latency_timeline_{name}.png- X-axis - a timeline in seconds, Y-axis - latency in ms, p50, p90 and p99
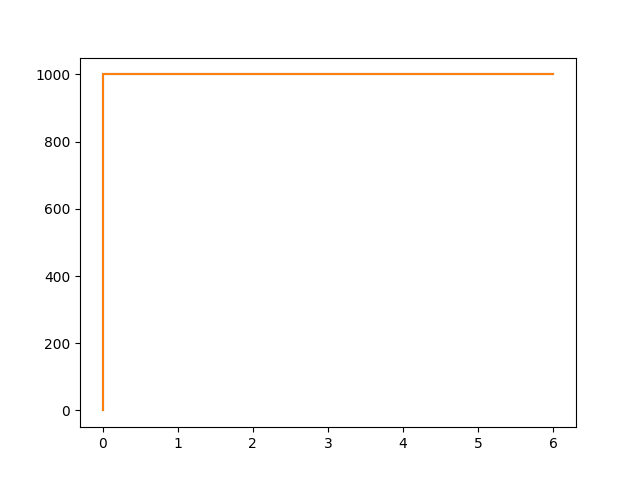
request_rate_{name}.png- X-axis - a timeline in seconds, Y-axis - effective RPS (successes only)
where {name} is the --name (or -N) parameter value.
You may need to use --pythob/-p parameter to specify python3 binary, if it's not in /usr/bin/python3. E.g.
concurrency-demo-benchmarks --name async_30s \
                            --rate 1000 \
                            --num_req 100000 \
                            --latency "20ms*9,30s" \
                            --python /somewhere/else/python3 \
                            async
Installation
cargo install concurrency-demo-benchmarks
Run batched/atomic/mutex increments benchmark
git clone https://github.com/xnuter/concurrency-demo-benchmarks.git
cargo bench
Command line options
A tool to model sync vs async processing for a network service

USAGE:
    concurrency-demo-benchmarks [OPTIONS] --name <NAME> --rate <RATE> --num_req <NUM_REQUESTS> --latency <LATENCY_DISTRIBUTION> [SUBCOMMAND]

FLAGS:
    -h, --help       Prints help information
    -V, --version    Prints version information

OPTIONS:
    -l, --latency <LATENCY_DISTRIBUTION>    Comma separated latency values. E.g. 200,200,200,500
    -N, --name <NAME>                       Name of the test-case
    -n, --num_req <NUM_REQUESTS>            Number of requests. E.g. 1000
    -p, --python_path <PYTHON_PATH>         Optional path to python3, e.g. /usr/bin/python3
    -r, --rate <RATE>                       Request rate per second. E.g. 100 or 1000

SUBCOMMANDS:
    async    Model a service with Async I/O
    help     Prints this message or the help of the given subcommand(s)
    sync     Model a service with Blocking I/O
Output example:
Latencies:
p0.000 - 0.477 ms
p50.000 - 0.968 ms
p90.000 - 1.115 ms
p95.000 - 1.169 ms
p99.000 - 1.237 ms
p99.900 - 1.295 ms
p99.990 - 1.432 ms
p100.000 - 1.469 ms
Avg rate: 1000.000, StdDev: 0.000
Run sync demo
- 1000 rps
- 20ms latency, 10 endpoints
- 500 threads
concurrency-demo-benchmarks --name sync_t500_20ms \
                            --rate 1000 \
                            --num_req 10000 \
                            --latency "20ms*10" \
                            sync --threads 500
- 1000 rps
- 60ms latency for 10 targets
- 500 threads
concurrency-demo-benchmarks --name sync_t500_60ms \
                            --rate 1000 \
                            --num_req 10000 \
                            --latency "60ms*10" \
                            sync --threads 500
- 1000 rps
- 20ms latency for 9 targets, but 30s for the other one
- 500 threads
concurrency-demo-benchmarks --name sync_t500_30s \
                            --rate 1000 \
                            --num_req 100000 \
                            --latency "20ms*9,30s" \
                            sync --threads 500
Run async demo
- 1000 rps
- 20ms latency, 10 targets
concurrency-demo-benchmarks --name async_20ms \
                            --rate 1000 \
                            --num_req 10000 \
                            --latency "20ms*10" \
                            async
- 1000 rps
- 60ms latency , 10 targets
concurrency-demo-benchmarks --name async_60ms \
                            --rate 1000 \
                            --num_req 100000 \
                            --latency "60ms*10" \
                            async
- 1000 rps
- 20ms latency but 30s for 10%
concurrency-demo-benchmarks --name async_30s \
                            --rate 1000 \
                            --num_req 100000 \
                            --latency "20ms*9,30s" \
                            async
Dependencies
~13–22MB
~310K SLoC
