6 releases
| 0.2.4 | Mar 1, 2025 |
|---|---|
| 0.2.3 | Feb 5, 2023 |
| 0.2.2 | Sep 29, 2022 |
| 0.2.1 | Jul 11, 2021 |
| 0.1.1 | Jul 8, 2021 |
#9 in #market-data
1MB
1.5K
SLoC
coinlive
![]()
![]()
![]()
Coinlive is an interactive command line tool that displays live cryptocurrency prices. It can also display simple historical price charts.
The data is provided by the Binance Spot API. The CLI is written in Rust and relies heavily on the superb tui library.
Installation
Coinlive is published to crates.io, so the installation is very easy:
- Install Rust. If you don't already have Rust installed, follow the instructions on rustup.rs.
- Issue
cargo install coinlive. This will install the executable in$HOME/.cargo/bin/.
If you get errors about Decimal32 and Decimal64 you probably have an older Rust version (<1.51, also see lib.rs for the likely minimum supported rust version "MSRV"). In this case please update the Rust compiler (rustup update).
Usage
Prices List
The price list page is the default page, it shows cryptocurrency prices updated in 1s intervals.
The cryptocurrency symbols are sorted by trading volume. When the quote currency is missing USDT is implied, for example BTC stands for BTCUSDT and ETH stands for ETHUSDT.
This is the default page. It can also be reached at any time by pressing l.
Compact notation for small prices
Some currency pairs have very small prices, for example SHIBUSDT at 0.000000734. These small numbers are difficult to read (how many zeros are there?) and take a lot of screen real estate. Therefore, a compact notation was adopted. For example, 0.000000734 is shown as 6\734, meaning there are 6 zeros after the decimal point before the first non-zero digit. Here are some examples:
- 2\61226 is 0.0061226
- 3\31772 is 0.00031772
- 4\871 is 0.0000871
- 5\1557 is 0.000001557
Prices Table
Prices are displayed in a grid. Vertically the base currency is shown, and horizontally the quote currency. For example, BTCUSDT has base currency BTC and quote currency USDT, and a price of 37000 means that 1 BTC is worth 37000 USDT Only the active markets are shown.
The price table can be reached by pressing t. By default the quote currencies shown are USDT, BTC, EUR, GBP, BNB, ETH, this is called the extended view. There is also a reduced view that only shows USDT, BTC, BNB, ETH. Toggle between extended and reduced view by pressing x ("extended").
Percentages
Prices list and prices table can also show the 24h percentage change. Press % to toggle between price and percentage view.
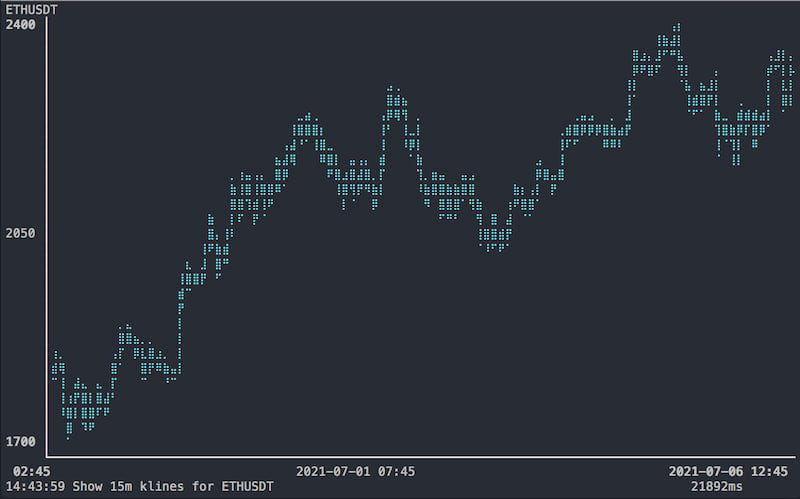
Historical Price Chart
The historical price chart is shown when pressing g or a number 0...9. 0 shows the last 1000 one-minute bars 1 shows the last 1000 5-minute bars, and so on. See the table below. g shows the graph of the currently selected symbol and time interval. On start the default is BTCUSDT 1-min bars.
The time scales can be selected with the keys 0...9 as follows:
| Key | Interval | Approx. time period |
|---|---|---|
| 0 | 1 min | 17 hours |
| 1 | 5 min | 3.5 days |
| 2 | 15 min | 10 days |
| 3 | 30 min | 3 weeks |
| 4 | 1 h | 6 weeks |
| 5 | 2 h | 12 weeks |
| 6 | 4 h | 5.5 months |
| 7 | 8 h | 11 months |
| 8 | 12 h | 16 months |
| 9 | 1 d | 2 years 9 months |
| g | currently selected |
By default the most liquid currency pair (usually BTCUSDT) is shown.
Note that the chart is static. You have to press g to refresh it.
Symbol selection
To select another currency pair, press s. Highlight the desired pair by moving the cursor. After pressing return the price chart for the selected pair is shown.
Help
Press h to see the help page.
Command Summary
| Key | Command | Remarks |
|---|---|---|
| h | Display help | |
| l | Show prices Iist | |
| t | Show prices table | |
| g | Show graph of current symbol and time-scale | Default symbol BTCUSDT, time-scale 1min |
| 0..9 | Show graph at time-scale 1min...1day | See table above |
| s | Select symbol | |
| Home | Set cursor to top left symbol | For select symbol page only |
| % | Toggle percent/price display | For list and table and views only |
| x | Toggle extended/reduced view | For table view only |
| a | Show about page | |
| Esc | Go back to previous view | |
| q, Ctrl-c | Quit |
Todo/Ideas
- Use
Decimal64in Graph page instead off64 - Live update price chart, or at least show price update in the message bar?
- Some currency information, such as market cap, would be nice. Coincap has an open API.
Disclaimers
There is no connection to coinlive.io or coinlive.com.
Dependencies
~21–35MB
~613K SLoC