2 releases
| 0.1.5 | Feb 19, 2022 |
|---|---|
| 0.1.4 |
|
#1386 in Game dev
27 downloads per month
5MB
4.5K
SLoC

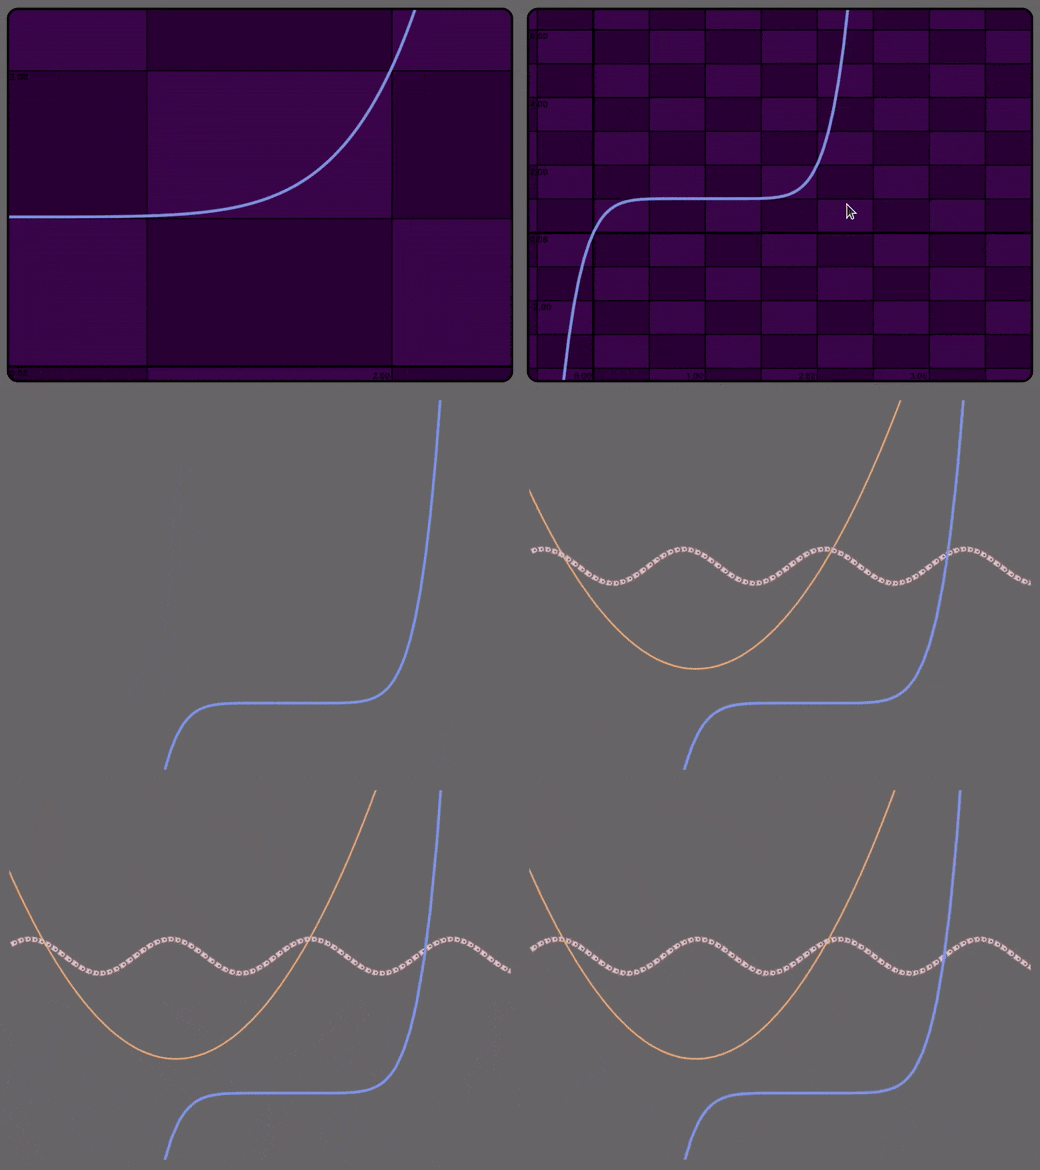
Plotting library for the Bevy game engine with a focus on esthetics and interactivity. It can handle both data points (see the "minimal", "markers", and "bevy" examples) and explicit functions (see the "func", "animate" and "runtime_setter" examples). Explicit functions are rendered using quadratic Bezier interpolation, thus smoothing out the curves.
Here is a link to the docs.

How to get started
Add "bevy_plot" to the dependencies list in the Cargo.toml file of your project, and have a look at the examples to see how to add the PlotPlugin, import and use the Plot asset.
TODO
- reduce API boilerplate
- interactive markers
- compatibility with 3d camera
- optimization
lib.rs:
Plotting library for the Bevy game engine. To quickly get started, run a Bevy App, add the
PlotPlugin to the App, instantiate a Plot struct, and either use the
Plot::plot(my_data: implPlotable)method for a regular graph, thePlot::plotm(my_data: implPlotable)method for a scatter plot (or plot with markers), or thePlot::plot_func(my_function: fn(f32, f32) -> 32)method that supports plotting of explicit functions.
The my_data argument of either of the first two methods has to implement the Plotable trait
(e.g. Vec<Vec2>, Vec<(f32, f32)>, Vec<f32>, etc.). In the third option,
my_function is an explicit function that takes two arguments (x and time) and returns a f32.
The following code can be found in examples/minimal.rs:
 use bevy::prelude::*;
 use bevy_plot::*;

 fn main() {
     App::new()
         .add_plugins(DefaultPlugins)
         .add_plugin(PlotPlugin)
         .add_startup_system(setup)
         .run();
 }

 fn setup(mut commands: Commands, mut plots: ResMut<Assets<Plot>>) {
     commands.spawn_bundle(OrthographicCameraBundle::new_2d());

     let mut plot = Plot::default();

     let xs = (0..30).map(|i| i as f32 / 30.0).collect::<Vec<f32>>();

     let ys = xs
         .iter()
         .map(|x| Vec2::new(*x, 0.5 * x))
         .collect::<Vec<Vec2>>();

     plot.plot(ys);

     let plot_handle = plots.add(plot.clone());
     commands.spawn().insert(plot_handle);
 }
For customizing the look of the curves and markers, see the [Opt] enum for the
available options together with the Plot::plotopt and
Plot::plotopt_func methods. For customizing the canvas (grid, colors, etc...), see the Plot fields.
Setting the range of the x and y axes is done with the Plot::set_bounds(lo, up) method, but bevy_plot
panics if lo.x > up.x or lo.y > up.y.
Note that the library allows the user to
- zoom in and out with the mousewheel,
- move the origin with the mouse by pressing and dragging,
- spawn a target and the corresponding coordinates by pressing the middle mouse button, and
- change the Plot fields at runtime (see examples/runtime_setter.rs).
Dependencies
~41–55MB
~1M SLoC