6 releases (breaking)
| 0.9.0 | Jun 22, 2024 |
|---|---|
| 0.8.1 | Jun 12, 2024 |
| 0.7.4 | Jun 10, 2024 |
| 0.6.0 | Jun 3, 2024 |
| 0.5.0 | May 31, 2024 |
#495 in Debugging
395 downloads per month
370KB
6.5K
SLoC
Universal Data Gateway for Zabbix server
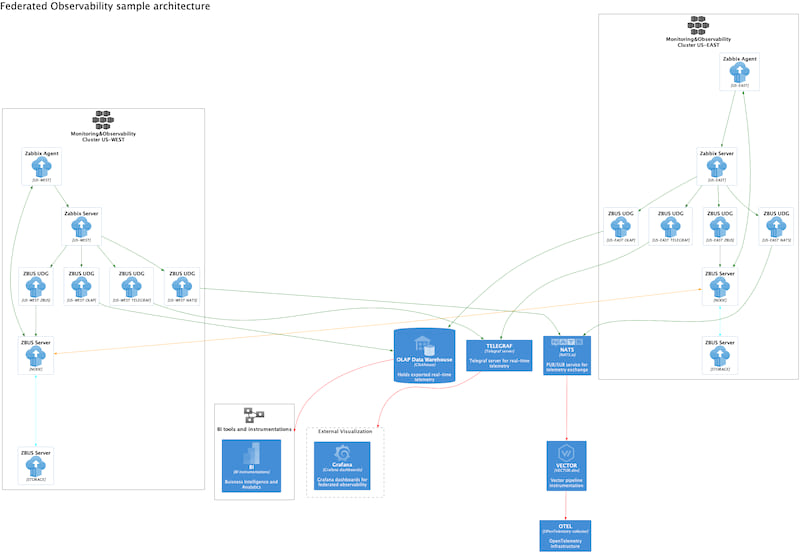
The Universal Data Gateway, or UDG for shorts, is essential in the Federated Zabbix ecosystem. It's a software component designed to extract, analyze, and share telemetry data produced by Zabbix Observability platforms. As a real-time data connector for Zabbix, it accepts telemetry data from the Zabbix server, converts it to extended JSON format, and then passes it to one of the output processors.
Telemetry connector
First, the standard internal component of ZBUS UDG is a real-time Zabbix connector interface. It catches data sent from the Zabbix server, extracts telemetry data from the payload, and feeds it to the internal "IN" pipeline.
Telemetry processor
The following internal software component is called a "PROCESSOR." This thread receives telemetry data from the "IN" internal pipeline, converts it to enhanced JSON, resolves the Zabbix item into the Zabbix key, and sends the result to the "OUT" internal pipeline.
Catching processor
Catching processor is a component of ZBUSUDG that is connecting to the selected telemetry generation and distribution service, collects the telemetry and route collected telemetry to the selected output processor. Currently, there are following catching processors are supported
Catching processor ZABBIX
When selected with CLI keyword --zabbix, it will start real-time ZABBIX telemetry catcher. In this example, we are running Zabbix real-time catcher and sending received telemetry to NONE output processor.
zbusdg --zabbix-api http://127.0.0.1:8080/zabbix gateway --zabbix --none --zabbix-token zabbixapitoken
Catching processor NATS_CATCHER
When selected with CLI keyword --nats-catcher, ZBUSUDG starts catching thread from NATS.io service by subscribing to the channel specified by --nats-subscribe-key. In this example, the first command is running Zabbix telemetry catcher and passing it to NATS in aggregate mode. The second command receiving telemetry from NATS server and send it to STDOUT output processors
zbusdg  --zabbix-api http://127.0.0.1/zabbix gateway --zabbix --nats --zabbix-token zabbixapitoken --nats-aggregate
zbusdg --zabbix-api http://127.0.0.1/zabbix gateway --nats-catcher  --zabbix-token zabbixtoken --stdout --pretty
Catching processor ZBUS
When selected with CLI keyword --zbus-catcher, ZBUSUDG starts catching thread from ZBUS telemetry bus by subscribing to the topic specified by --zbus-subscribe-key. In this example we are catching metrics from telemetry bus and sending them to standard output.
zbusdg --zabbix-api http://127.0.0.1/zabbix gateway --zbus-catcher --stdout --pretty
Catching processor PROMETHEUS_EXPORTER
When selected with CLI keyword --prometheus-exporter-catcher, ZBUSUDG starts collection thread that will scrapte metrics from Prometheus exporters and convert them to ZBUS telemetry format. In this example we are scrapting Prometheus telemetry and sending them to standard output.
zbusdg --zabbix-api http://127.0.0.1/zabbix gateway --prometheus-exporter-catcher --stdout --pretty
Catching SYSLOGD messages
When selected with CLI keyword --syslogd-catcher, ZBUSUDG starts collection thread that will receive a standard syslogd messages and pass it for delivery to any supported output processor.
zbusdg gateway --syslogd-catcher --stdout --pretty
Output processor
The function of the UDG's output processor is to read prepared telemetry from the "OUT" internal pipeline and send it to the proper destination.
Here is the list of the available output processors for the Universal Data Gateway
Output processor NONE
As the name suggests, this is a NOOP telemetry processor. If the gateway executes with this processor, the collected telemetry will be silently discarded.
zbusdg --zabbix-api http://127.0.0.1/zabbix gateway --zabbix --none --zabbix-token zabbixapitoken
Output processor STDOUT
Collected telemetry received from the "OUT" internal pipeline will be delivered to the standard output. If you specify —-pretty as the UDG CLI option, the processor will prettify the output JSON.
zbusdg --zabbix-api http://127.0.0.1/zabbix gateway --zabbix --stdout --pretty --zabbix-token zabbixapitoken
Output processor SOCKET
Telemetry in JSON format will be delivered to the raw TCP socket, one telemetry item per line.
zbusdg --zabbix-api http://127.0.0.1/zabbix gateway --zabbix --socket --pretty --zabbix-token zabbixapitoken --tcp-connect 127.0.0.1:55554
To accept the telemetry, you can run the following command
nc -k -l 55554
Output processor ZBUS
Collected telemetry is shipped to the ZBUS telemetry bus, stored for storage, and delivered to all Zabbix federated observability members. Delivery could be performed in aggregated or per Zabbix key mode. If aggregated delivery is specified, all telemetry will be delivered to a single key on the bus; otherwise, the gateway will extract a destination key from the telemetry message.
Delivery with telemetry aggregation
zbusdg --zabbix-api http://127.0.0.1/zabbix gateway --zabbix --zbus --zabbix-token zabbixapitoken --zbus-aggregate --zbus-aggregate-key mykey
Delivery without aggregation, to an individual item keys
zbusdg  --zabbix-api http://127.0.0.1/zabbix gateway --zabbix --nats --zabbix-token zabbixapitoken --nats-aggregate
zbusdg --zabbix-api http://127.0.0.1/zabbix gateway --zabbix --zbus --zabbix-token zabbixapitoken
Output processor NATS
Collected telemetry is shipped to the NATS.io server, and could be accessed by any NATS.io client. Delivery could be performed in aggregated or per Zabbix key mode. If aggregated delivery is specified, all telemetry will be delivered to a single key on the bus; otherwise, the gateway will extract a destination key from the telemetry message.
Delivery with telemetry aggregation
zbusdg --zabbix-api http://127.0.0.1/zabbix gateway --zabbix --nats --zabbix-token zabbixapitoken --nats-aggregate --nats-aggregate-key mykey
Delivery without aggregation,to an individual item keys
zbusdg --zabbix-api http://127.0.0.1/zabbix gateway --zabbix --nats --zabbix-token zabbixapitoken
Output processor MQTT
Collected telemetry is shipped to the MQTT server, and could be accessed by any MQTT client. Delivery could be performed in aggregated only mode.
Delivery with telemetry aggregation
zbusdg --zabbix-api http://192.168.86.29/zabbix gateway --zabbix --mqtt --zabbix-token zabbixapitoken --mqtt-aggregate-key mykey
Output processor STATSD
Collected telemetry is shipped to the STATSD server, and could be accessed by any component of STATSD ensemble.
zbusdg --zabbix --zabbix-api http://192.168.86.29/zabbix gateway --statsd --zabbix-token zabbixapitoken
Output processor TELEGRAF
Collected telemetry is shipped to the Telegraf server, and could be integrated with InfluxDB, Grafana and all other Observability tools and platforms supported by Telegraf.
zbusdg --zabbix-api http://192.168.86.29/zabbix gateway --zabbix --telegraf --zabbix-token zabbixapitoken
Output processor CLICKHOUSE
Collected telemetry is shipped to the Clickhouse OLAP columnar storage, and could be used by any tools that supported clickhouse.
zbusdg --zabbix-api http://192.168.86.29/zabbix gateway --zabbix --clickhouse --zabbix-token zabbixapitoken
Output processor ZABBIX SENDER
Collected telemetry is shipped to Zabbix Sender interface. Zabbix hostname will be extracted from origin field and Zabbix key will be extracted from zabbix_item key
zbusdg gateway --syslogd-catcher --zabbix-sender --zabbix-sender-connect 127.0.0.1:10051
Send UDG telemetry to ZBUS
ZBUS UDG can send some internal telemetry alongside with telemetry received from Zabbix server.
Monitor elapsed time spent in processing JSON telemetry batches
You can monitor elapsed time for JSON batch processing by passing --telemetry-monitor-elapsed to the gateway command line target. Trelemetry will be submitted to the key /zbus/udg/elapsed
zbusdg --zabbix --zabbix-api http://192.168.86.29/zabbix gateway --nats --zabbix-token zabbixapitoken --telemetry-monitor-elapsed
Programmatic control for telemetry processing
You can add a programmatic control for the filtering and telemetry transformation with help from some RHAI scripting.
Telemetry filtering
You can create a scripted function, that will control if telemetry is accepted or not by ZBUSUDG. For that, you cave to create a file, for example ./scripts/allowall.rhai containing function
fn filter(data) {
  true
}
and then pass reference to this script to ZBUSUDG as illustrated here
zbusdg --zabbix-api http://127.0.0.1/zabbix gateway --zabbix --stdout --zabbix-token zabbixtoken --script ./scripts/allowall.rhai
Telemetry transformation
In ZBUS, telemetry is represented in JSON format. You can programmatically add or modify content of telemetry JSON by creating a RHAI script ./scripts/allowall.rhai and define function that will transform telemetry JSON data
fn transformation(data) {
 data.body.details.added_by_transformation = "Transformation routine been here";
 data
}
and then pass reference to this script to ZBUSUDG as illustrated here
zbusdg --zabbix-api http://127.0.0.1/zabbix gateway --zabbix --stdout --zabbix-token zabbixtoken --script ./scripts/allowall.rhai
Programmatic telemetry generation and processing
ZBUSUDG can generate and process programmatically created telemetry. This capability is supported by two functions: the generator function and the processing function. The generator function accepts no arguments and returns a list of ObjectMaps representing the telemetry. As an illustration, the generator function generator() generates two telemetry items each time it runs. The first item is a static value, while the second is a programmatically generated random float.
fn generator() {
    log::info("Generating two telemetry items");
    let data_pi = #{
        body: #{
            details: #{
                destination:    "zbus/generated_metric/local/pi",
                origin:         ZBUS_SOURCE,
                details:        #{
                        contentType:    0,
                        detailType:     "",
                        data:           3.14,
                },
            },
            properties: #{
                name:       "Return a static metric with a value of PI",
                tags:       [],
                itemname:   "pi",
                timestamp:  timestamp::timestamp_ms(),
            },
        },
        headers: #{
            version:                ZBUS_PROTOCOL_VERSION,
            encryptionAlgorithm:    (),
            compressionAlgorithm:   (),
            cultureCode:            (),
            messageType:            "generated_telemetry",
            route:                  ZBUS_ROUTE,
            streamName:             ZBUS_SOURCE,
        },
    };

    let data_float = #{
        body: #{
            details: #{
                destination:    "zbus/generated_metric/local/random_float",
                origin:         ZBUS_SOURCE,
                details:        #{
                        contentType:    0,
                        detailType:     "",
                        data:           rand_float(0.1, 9.99),
                },
            },
            properties: #{
                name:       "Return a static metric with a value of PI",
                tags:       [],
                itemname:   "random_float",
                timestamp:  timestamp::timestamp_ms(),
            },
        },
        headers: #{
            version:                ZBUS_PROTOCOL_VERSION,
            encryptionAlgorithm:    (),
            compressionAlgorithm:   (),
            cultureCode:            (),
            messageType:            "generated_telemetry",
            route:                  ZBUS_ROUTE,
            streamName:             ZBUS_SOURCE,
        },
    };

    [data_pi, data_float]
}
The function processor() is designed to handle telemetry post-processing. It receives a telemetry item as a parameter; however, the return value is currently disregarded. The provided sample function simply prints the telemetry and returns it. This summarizes the function's current behavior.
fn processor(data) {
    print(data);
    data
}
To enable the use of programmatic telemetry processors and catchers, it is necessary to specify the CLI option --rhai-catcher to initiate the programmatic telemetry generator. Similarly, the launch of the programmatic telemetry receiver requires the use of the --rhai CLI option. This enables the smooth flow of telemetry through the ZBUSUDG, facilitating delivery to a programmatic processor.
zbusdg gateway --rhai-catcher --rhai --script ./scripts/helloworld.rhai --analysis
Monitor ZBUS submission
In order to verify and debug your gateway, you can run zbusudg in the "monitor mode", where you subscribing to the key on ZBUS and dump on STDOUT all data packets received on that key.
zbusudg monitor
JSON RPC interface for querying the metrics that been discovered on ZBUS
You can query metrics that has been published on ZBUS. JSON RPC server is listening for the ZBUS topic for submitted metric and stores last 128 real-time values of all discovered metrics. By default JSON RPC server is listening on port 10060 but you can redefine that with CLI option --api-listen . You can also change the topic of ZBUS with CLI option --zbus-key. JSON RPC api server launched as:
zbusudg api
The server exposes following methods
metrics - receiving the list of discovered metrics
This call returns the list of discovered metrics published on ZBUS to the specified topic.
curl -X POST -H 'Content-Type: application/json' -d '{"jsonrpc":"2.0","id":"id","method":"metrics","params":[]}' http://127.0.0.1:10060
Sample result will be
{"jsonrpc":"2.0","result":["zbus/metric/v2/local/agent.ping","zbus/metric/v2/local/net.if.in/enp0s3","zbus/metric/v2/local/net.if.in/enp0s3/dropped","zbus/metric/v2/local/net.if.in/enp0s3/errors","zbus/metric/v2/local/net.if.out/enp0s3","zbus/metric/v2/local/net.if.out/enp0s3/dropped","zbus/metric/v2/local/net.if.out/enp0s3/errors","zbus/metric/v2/local/proc.num","zbus/metric/v2/local/proc.num/run","zbus/metric/v2/local/system.cpu.intr","zbus/metric/v2/local/system.cpu.load/all/avg1","zbus/metric/v2/local/system.cpu.load/all/avg15","zbus/metric/v2/local/system.cpu.load/all/avg5","zbus/metric/v2/local/system.cpu.switches","zbus/metric/v2/local/system.cpu.util","zbus/metric/v2/local/system.cpu.util/guest","zbus/metric/v2/local/system.cpu.util/guest_nice","zbus/metric/v2/local/system.cpu.util/idle","zbus/metric/v2/local/system.cpu.util/interrupt","zbus/metric/v2/local/system.cpu.util/iowait","zbus/metric/v2/local/system.cpu.util/nice","zbus/metric/v2/local/system.cpu.util/softirq","zbus/metric/v2/local/system.cpu.util/steal","zbus/metric/v2/local/system.cpu.util/system","zbus/metric/v2/local/system.cpu.util/user","zbus/metric/v2/local/system.localtime","zbus/metric/v2/local/system.swap.size/free","zbus/metric/v2/local/system.swap.size/pfree","zbus/metric/v2/local/system.swap.size/total","zbus/metric/v2/local/system.uptime","zbus/metric/v2/local/system.users.num","zbus/metric/v2/local/vfs.dev.queue_size/sda","zbus/metric/v2/local/vfs.dev.read.await/sda","zbus/metric/v2/local/vfs.dev.read.rate/sda","zbus/metric/v2/local/vfs.dev.read.time.rate/sda","zbus/metric/v2/local/vfs.dev.util/sda","zbus/metric/v2/local/vfs.dev.write.await/sda","zbus/metric/v2/local/vfs.dev.write.rate/sda","zbus/metric/v2/local/vfs.dev.write.time.rate/sda","zbus/metric/v2/local/vfs.file.contents","zbus/metric/v2/local/vfs.fs.dependent.inode/\\/pfree","zbus/metric/v2/local/vfs.fs.dependent.inode/\\boot/pfree","zbus/metric/v2/local/vfs.fs.dependent.size/\\/pused","zbus/metric/v2/local/vfs.fs.dependent.size/\\/total","zbus/metric/v2/local/vfs.fs.dependent.size/\\/used","zbus/metric/v2/local/vfs.fs.dependent.size/\\boot/pused","zbus/metric/v2/local/vfs.fs.dependent.size/\\boot/total","zbus/metric/v2/local/vfs.fs.dependent.size/\\boot/used","zbus/metric/v2/local/vfs.fs.dependent/\\/data","zbus/metric/v2/local/vfs.fs.dependent/\\/readonly","zbus/metric/v2/local/vfs.fs.dependent/\\boot/data","zbus/metric/v2/local/vfs.fs.dependent/\\boot/readonly","zbus/metric/v2/local/vm.memory.size/available","zbus/metric/v2/local/vm.memory.size/pavailable","zbus/metric/v2/local/vm.memory.size/total","zbus/metric/v2/local/vm.memory.utilization","zbus/metric/v2/local/zabbix/connector_queue","zbus/metric/v2/local/zabbix/host/agent/available","zbus/metric/v2/local/zabbix/lld_queue","zbus/metric/v2/local/zabbix/preprocessing_queue","zbus/metric/v2/local/zabbix/process/alert/manager/avg/busy","zbus/metric/v2/local/zabbix/process/alert/syncer/avg/busy","zbus/metric/v2/local/zabbix/process/alerter/avg/busy","zbus/metric/v2/local/zabbix/process/availability/manager/avg/busy","zbus/metric/v2/local/zabbix/process/configuration/syncer/avg/busy","zbus/metric/v2/local/zabbix/process/connector/manager/avg/busy","zbus/metric/v2/local/zabbix/process/connector/worker/avg/busy","zbus/metric/v2/local/zabbix/process/discoverer/avg/busy","zbus/metric/v2/local/zabbix/process/escalator/avg/busy","zbus/metric/v2/local/zabbix/process/history/poller/avg/busy","zbus/metric/v2/local/zabbix/process/history/syncer/avg/busy","zbus/metric/v2/local/zabbix/process/housekeeper/avg/busy","zbus/metric/v2/local/zabbix/process/http/poller/avg/busy","zbus/metric/v2/local/zabbix/process/icmp/pinger/avg/busy","zbus/metric/v2/local/zabbix/process/lld/manager/avg/busy","zbus/metric/v2/local/zabbix/process/lld/worker/avg/busy","zbus/metric/v2/local/zabbix/process/odbc/poller/avg/busy","zbus/metric/v2/local/zabbix/process/poller/avg/busy","zbus/metric/v2/local/zabbix/process/preprocessing/manager/avg/busy","zbus/metric/v2/local/zabbix/process/preprocessing/worker/avg/busy","zbus/metric/v2/local/zabbix/process/proxy/poller/avg/busy","zbus/metric/v2/local/zabbix/process/self-monitoring/avg/busy","zbus/metric/v2/local/zabbix/process/service/manager/avg/busy","zbus/metric/v2/local/zabbix/process/task/manager/avg/busy","zbus/metric/v2/local/zabbix/process/timer/avg/busy","zbus/metric/v2/local/zabbix/process/trapper/avg/busy","zbus/metric/v2/local/zabbix/process/trigger/housekeeper/avg/busy","zbus/metric/v2/local/zabbix/process/unreachable/poller/avg/busy","zbus/metric/v2/local/zabbix/queue","zbus/metric/v2/local/zabbix/queue/10m","zbus/metric/v2/local/zabbix/rcache/buffer/pused","zbus/metric/v2/local/zabbix/tcache/cache/pitems","zbus/metric/v2/local/zabbix/tcache/cache/pmisses","zbus/metric/v2/local/zabbix/vcache/buffer/pused","zbus/metric/v2/local/zabbix/vcache/cache/hits","zbus/metric/v2/local/zabbix/vcache/cache/misses","zbus/metric/v2/local/zabbix/vcache/cache/mode","zbus/metric/v2/local/zabbix/wcache/history/pused","zbus/metric/v2/local/zabbix/wcache/index/pused","zbus/metric/v2/local/zabbix/wcache/trend/pused","zbus/metric/v2/local/zabbix/wcache/values","zbus/metric/v2/local/zabbix/wcache/values/float","zbus/metric/v2/local/zabbix/wcache/values/log","zbus/metric/v2/local/zabbix/wcache/values/not/supported","zbus/metric/v2/local/zabbix/wcache/values/str","zbus/metric/v2/local/zabbix/wcache/values/text","zbus/metric/v2/local/zabbix/wcache/values/uint"],"id":"id"}
last - last received value for specific metrics
This call returns the last received value
curl -X POST -H 'Content-Type: application/json' -d '{"jsonrpc":"2.0","id":"id","method":"last","params":["zbus/metric/v2/local/system.uptime"]}' http://127.0.0.1:10060
Will return
{"jsonrpc":"2.0","result":1809559,"id":"id"}
sample - returns a sampled values
This call will return last 128 or less sampled values for the metric.
curl -X POST -H 'Content-Type: application/json' -d '{"jsonrpc":"2.0","id":"id","method":"sample","params":["zbus/metric/v2/local/system.uptime"]}' http://127.0.0.1:10060
Will return
{"jsonrpc":"2.0","result":[1808809,1808839,1808869,1808899,1808929,1808959,1808989,1809019,1809049,1809079,1809109,1809139,1809169,1809199,1809229,1809259,1809289,1809319,1809350,1809380,1809409,1809439,1809469,1809499,1809529,1809559,1809589],"id":"id"}
Real-time metrics computation
If you want to enable real-time metrics computation, you can use the --analysis CLI argument to activate the "Analysis" mode for the Universal Data Gateway (ZBUSUDG). This mode allows ZBUSUDG to perform real-time statistical computations and forecasts while collecting telemetry data. ZBUSUDG will gather the most recent 128 float-point type telemetry samples. Then it will then enhance relevant metric with additional data attributes such as mean, max, min, variance, standard deviation, statistical oscillation, statistical time series forecast, anomalies detection using statistical analysis, breakouts in a sample and forecasting using Markov chains of the sample.
Real-time logs analysis
If you are pass CLI option --logs-analysis , you will launch log analysis threads and will enchance all logs telemetry with logs analysis data.
{
  "body": {
    "details": {
      "destination": "zbus/log/syslog",
      "details": {
        "analytical_data": {
          "category": "ssh"
        },
        "contentType": 2,
        "data": "syslog[85654]: Failed password from root",
        "detailType": ""
      },
      "origin": "home.lan",
      "properties": {
        "syslog_appname": "unknown",
        "syslog_facility": 0,
        "syslog_procid": "unknown",
        "syslog_severity": 7,
        "syslog_version": 0,
        "timestamp": 1718680671000000000,
        "zabbix_item": "log[/var/log/syslog]"
      }
    }
  },
  "headers": {
    "compressionAlgorithm": null,
    "cultureCode": null,
    "encryptionAlgorithm": null,
    "messageType": "telemetry",
    "route": "local",
    "streamName": "local",
    "version": "v2"
  },
  "id": "Ez2JWwSDsOZN-74gPF6dr"
}
Real-time Zabbix alerts receive
ZBUSUDG can receive and publish Zabbix alerts to ZBUS universal telemetry bus as a telemetry item, thus implementing the idea "Alerts is a Telemetry data too". You can launch alerts receiver
zbusudg alerts
and then you can receive alerts as a telemetry from the Universal Telemetry Bus
zbusdg gateway --stdout --pretty --zbus-catcher --zbus-subscribe-key events
This is the sample of alert
{
  "body": {
    "details": {
      "destination": "/events",
      "details": {
        "contentType": 3,
        "data": 1,
        "detailType": ""
      },
      "origin": "home.lan",
      "properties": {
        "groups": [
          "Linux servers"
        ],
        "name": "SLA triggered",
        "tags": [
          {
            "tag": "SLA",
            "value": "TEST"
          }
        ],
        "zabbix_clock": 1719087396,
        "zabbix_eventid": 81,
        "zabbix_host_name": [
          {
            "host": "test_host",
            "name": "test_host"
          }
        ],
        "zabbix_ns": 170124227
      }
    }
  },
  "headers": {
    "compressionAlgorithm": null,
    "cultureCode": null,
    "encryptionAlgorithm": null,
    "messageType": "event",
    "route": "local",
    "streamName": "local",
    "version": "v2"
  },
  "id": "iZ6qykdOkpDoRK10rM9Wp"
}
Dependencies
~91MB
~1.5M SLoC