1 unstable release
| 0.1.0 | Jun 23, 2024 |
|---|
#4 in #zabbix
26KB
349 lines
Introduction
Observing and monitoring complex environments can be a difficult task due to the complexity of the environment itself. As the complexity of the environment increases, setting up an influential and representative Observability configuration becomes more challenging. The key to managing Observability infrastructure is comprehending and managing its complexity rather than just its scalability. While scalability is important, it is a more controllable aspect of Observability infrastructure management than complexity. Therefore, the success of an Observability infrastructure largely depends on how well its complexity is managed. But what are the keys to successfully managing complexity as a primary goal and scalability as the secondary? We have to keep a few aspects in mind that will help us navigate those obstacles:
Storytelling.
It is not advisable to base your assessment of the controlled environment solely on raw telemetry data. Instead, it is essential to integrate various telemetry items to create a comprehensive narrative. This constructed narrative, which can serve as a basis for further analysis, is your first step in addressing the challenges of observability complexity.
Aggregation
It is important to avoid relying on individual data points or observations when monitoring a controlled environment. Instead, it is best to collect and analyze data over a period of time using various methods. Those efforts will provide a more comprehensive understanding of the processes and a better insight into the data rather than simply observing random telemetry values.
Separation and dependency management
As the controlled environment becomes more complex, it generates more data and alerts. This complexity and scale can sometimes overwhelm your Observability platform with the vast amount of generated artifacts.nd To handle this high volume of data, it's crucial to create well-defined silos between the different platform components that address specific artifacts. Treating these components as black boxes with clear and precise inputs and outputs is essential. Doing so will enable you to respond effectively to increased complexity and scale by controlling the performance and scale of individual components.
Solution.
Different vendors have suggested numerous solutions to tackle the issues mentioned earlier. Some of these solutions have proved to be effective in addressing these concerns. However, from my experience in monitoring and observability architecture and practices, there are specific challenges that an Observability Architect or integrator must overcome before claiming to have solved the problem.
Flatten the metrics.
Various collecting points produce metrics with different formats. The observability platform unifies them.
Make metrics available in real time.
The platform for observability should allow easy and quick access to commonly accepted metrics in real-time.
Create black boxes.
The platform for observability should consist of a hierarchy of observability components. Each component handles specific telemetry items and stories, producing predetermined derivative items, alerts, and SLAs.
Manage globally accessible cache of telemetry, alerts, and SLAs.
Distributed, or I would instead use the term "federated" observability platform, requires transparent access to all the artifacts that the federation of the components produces.
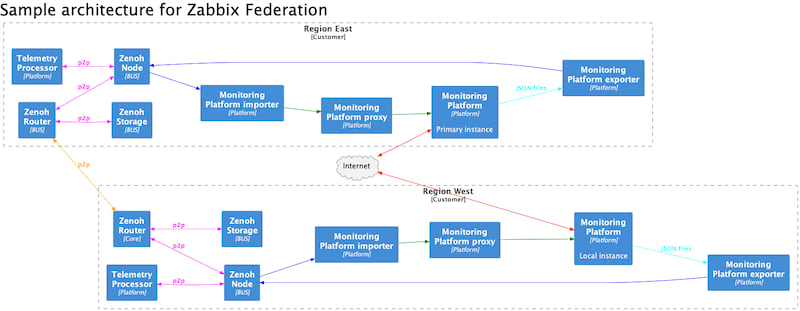
Show me
I've picked several "off-the-shelf" software solutions to deliver a proof-of-concept for the federated observability platform.
-
Zabbix is a battle-tested open-source observability platform that can handle sophisticated data collection, alert generation, and escalations. What is essential for my POC provides me with a simple yet effective way to catch telemetry, alerts, and other generated artifacts.
-
Zenoh is a well-tested peer-to-peer networking solution with a simple and effective API and existing plugins that support data's "storage and delivery" to multiple subscribers. Out of all the pub/sub solutions that exist, I've chosen a particularly peer-to-peer solution that will help create complex observability solutions.
And to make those components "act together," I've created two "missed" software components.
-
zbus is a command-line tool that provides all necessary interfacing between Zabbix and Zenoh.
-
zabbix_zbus_module is a loadable module that you can load in Zabbix Agent and, through that agent, query data stored in a Zenoh peer-to-peer network.
How to start Zenoh server ?
zenohd --adminspace-permissions=rw --cfg='plugins/storage_manager/storages/demo:{key_expr:"zbus/**",volume:"memory"}'
Store telemetry item on Zenoh network.
zbus put --key pi --value 3.1401
This command stores a single key with name "pi" and value of 3.1401 on Zenoh p2p network. If our Zabbix agent is started and zbus loadable module is loaded, we can query this data through the Zabbix
zabbix_get -s 192.X.X.X -k "zbus.get_float[zbus/metric/v1/local/home.lan/pi]"
This module supprts three targets: zbus.get_int, zbus.get_str and zbus.get_float to get Integer, String and Float values respectively. The parameters to the request is the metric key. Metric key consist of:
zbus "/" type of metric "/" version of the zbus exchange "/" name of Zabbix instance "/" hostname "/" key
where the type of metrics could be "metric", "event", "log".
Retrieve telemetry item from Zenoh network using CLI.
zbus get --key pi
The output will be
{"key":"zbus/metric/v1/local/home.lan/pi","platform":"local","skey":"pi","src":"home.lan","ts":1702077425285763000,"value":3.1401}
You can send a full key query to a Zenoh bus using that command
zbus query query-raw --key "zbus/metric/v1/local/home.lan/pi"
How to send a data from Zabbix to the Zenoh bus?
Currently, you shall use zbus tool to export data from Zabbix history JSON files. But before you send an export, you have to update Zabbix metadata on Zenoh.
zbus api --endpoint=http://192.X.X.X/zabbix metadata --token=XXXXXXXXXXXXXXXXX --sync-zbus
You can generate API access token through Zabbix UI, or take it from stdout of the command
zbus api login --login loginname --password password
After you sync a metadata, you can start to export Zabbix telemetry to the bus
zbus export history --path ./example/data --search "history*"
The path that you pass as --path, must contain history JSON files. You can check the outcome of the export
zabbix_get -s 192.X.X.X -k "zbus.get_str[zbus/metric/v1/local/Zabbix server/vfs.fs.dependent/\boot/data]"
As an alternative to the using JSON files, you can start a real-time connector and configure Zabbix to send you history data through that connector
zbus -d export stream --history --bus --threads 4 --listen http://127.0.0.1:10055
You can also scrape data from Prometheus exporter and ingest this data into a telemetry bus
zbus export prometheus --in-loop --every 15 --exporter http://127.0.0.1:9100/metrics
How to send SLA data from Zabbix servers to a Zenoh bus ?
Access to the calculated "service level indicators" is one of the crucial features of the Observability platform. Multiple servers in a federated environment can compute SLI for the services that they control. To bring a proper perspective and high-level view of service availability, we can now calculate a compound SLI while taking low-level SLI as a calculation foundation.
This command exports currently computed SLI to the zbus.
zbus export sla --endpoint=http://192.X.X.X/zabbix --token=XXXXXXXXXXXXXXXXX
SLI that are stored on the bus are queryable.
zbus query query-raw --key "zbus/sli/v1/local/SLA 1/SLA test service" --all
with outcome as
{"downtime":853,"name":"SLA 1","service":"SLA test service","sli":8.867521367521368,"uptime":83}
You can also get a JSON output through Zabbix Agent by using key zbus.get_raw and process JSON keys in Zabbix as needed
zabbix_get -s 192.X.X.X -k "zbus.get_raw[zbus/sli/v1/local/SLA 1/SLA test service]"
output will be the same
{"downtime":853,"name":"SLA 1","service":"SLA test service","sli":8.867521367521368,"uptime":83}
How to execute a ZB-script scripts using zbus tool
Sub-command "script" will initiate ZB-script interpreter and pass script to execution. The keys of this sub-command are:
- --stdin - take script form standard input.
- --file - take script from local file. Full path to the file is expected.
- --uri - take script from HTTP/HTTPS server.
- --eval - pass script snippet throug CLI
You can pass arguments to the ZB-scipt engine after ""--"" like following
zbus script --eval "print(ARGV)" -- 1 2 3
The arguments will be passed to global variable ARGV in ZB-script engine.
Dependencies
~25–38MB
~625K SLoC