1 unstable release
| 0.1.0 | Oct 30, 2020 |
|---|
#27 in #planning
18KB
474 lines
A CLI tool to visualize dependencies between tasks in form of graph.
Installation
Prerequisites:
- graphviz (
dotexecutable)
cargo install xplan
Usage
Describe the project tasks and dependencies in YAML file, that execute the command to generate dependency graph:
xplan ./project.yml

Created file: project.svg
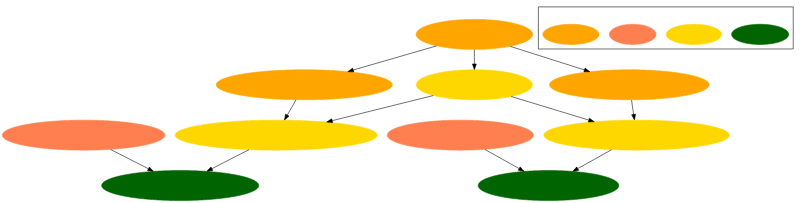
Get a graph similar to this one:
YAML file:
tasks:
  TIN-1:
    name: define User model
    type: common
  TIN-2:
    name: create users table
    type: backend
    deps: [TIN-1]

  TIN-3:
    name: define Register API endpoint
    type: common
    deps: [TIN-1]
  TIN-4:
    name: define Login API endpoint
    type: common
    deps: [TIN-1]

  TIN-5:
    name: implement Register API endpoint
    type: backend
    deps: [TIN-2, TIN-3]
  TIN-6:
    name: implement Login API endpoint
    type: backend
    deps: [TIN-2, TIN-4]

  TIN-7:
    name: UI mock for Register page
    type: design
  TIN-8:
    name: UI mock for Login page
    type: design

  TIN-9:
    name: Implement Register page
    type: frontend
    deps: [TIN-5, TIN-7]
  TIN-10:
    name: Implement Login page
    type: frontend
    deps: [TIN-6, TIN-8]
Generated dependency graph:
Dependencies
~4MB
~75K SLoC