11 releases
| 0.1.12 | Mar 9, 2025 |
|---|---|
| 0.1.11 | Jan 14, 2022 |
| 0.1.10 | Jun 3, 2021 |
| 0.1.9 | Nov 14, 2020 |
| 0.1.2 | Mar 31, 2019 |
#116 in Debugging
22 downloads per month
600KB
6K
SLoC
ugdb
ugdb is an unsegen based alternative TUI for gdb.
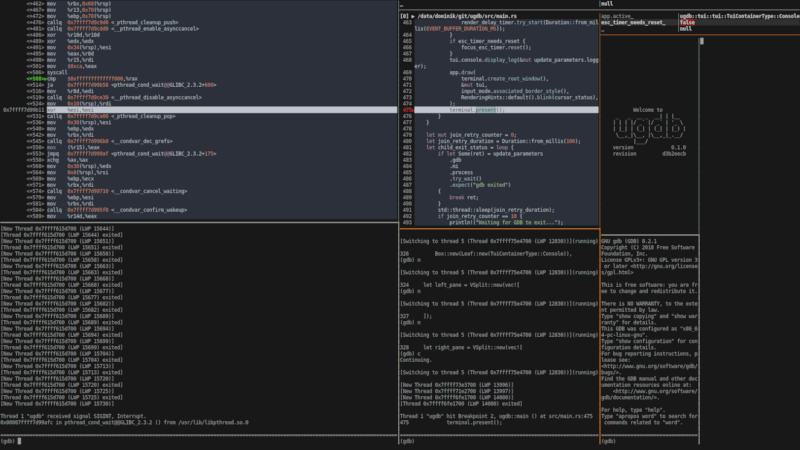
Screenshots
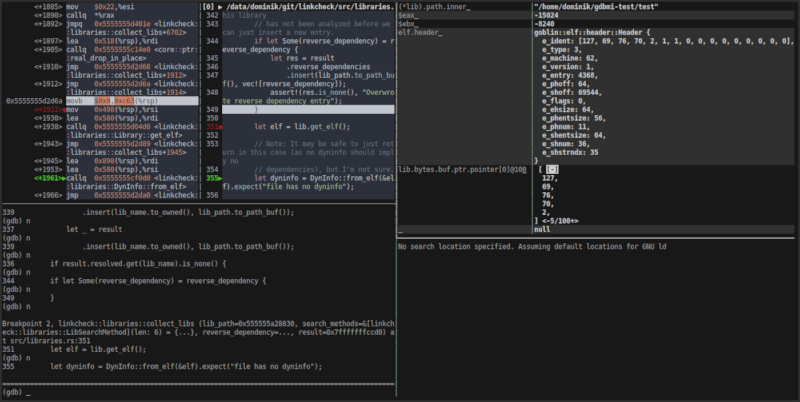
What's that? Oh, yes. Yes, you can totally use ugdb to debug ugdb debugging ugdb.
Building
ugdb is written in Rust and needs a working installation of cargo to build.
$ git clone https://github.com/ftilde/ugdb
$ cd ugdb
$ cargo build --release
$ target/release/ugdb
Installation
If you're an Arch Linux user, then you can install ugdb from the arch user repository:
yay -S ugdb
ugdb can also be installed from crates.io using cargo:
cargo install ugdb
Usage
The command line interface is aimed to be mostly compatible with gdb:
$ ugdb --help
ugdb 0.1.12
ftilde <ftilde@REDACTED>
An alternative TUI for gdb

USAGE:
    ugdb [FLAGS] [OPTIONS] [--] [program]...

FLAGS:
    -h, --help       Prints help information
        --nh         Do not execute commands from ~/.gdbinit.
    -n, --nx         Do not execute commands from any .gdbinit initialization files.
    -q, --quiet      "Quiet".  Do not print the introductory and copyright messages.  These messages are also suppressed
                     in batch mode.
        --rr         Start ugdb as an interface for rr. Trailing ugdb arguments will be passed to rr replay instead.
    -V, --version    Prints version information

OPTIONS:
    -b <bps>
            Set the line speed (baud rate or bits per second) of any serial interface used by GDB for remote debugging.

        --cd <cd>
            Run GDB using directory as its working directory, instead of the current directory.

    -x, --command <command_file>                                      Execute GDB commands from file.
    -c, --core <core_file>                                            Use file file as a core dump to examine.
        --gdb <gdb_path>                                              Path to alternative gdb binary. [default: gdb]
    -e, --initial-expression <initial_expression_table_entries>...    Define initial entries for the expression table.
        --layout <layout>
            Define the initial tui layout via a format string. [default: (1s-1c)|(1e-1t)]

        --log_dir <log_dir>
            Directory in which the log file will be stored. [default: /tmp]

    -p, --pid <proc_id>                                               Attach to process with given id.
        --rr-path <rr_path>                                           Path to alternative rr binary. [default: rr]
    -d, --directory <source_dir>
            Add directory to the path to search for source files.

    -s, --symbols <symbol_file>                                       Read symbols from the given file.

ARGS:
    <program>...    Path to program to debug (with arguments).
Some notable differences:
- Command line arguments to the program to be debugged can be specified without the
-a-flag of gdb. (But don't forget--!) - You can specify an alternative gdb via the
--gdbargument. Go debug your Rust:$ ugdb --gdb=rust-gdb! By default,gdbin$PATHwill be used. - An alternative log file directory can be specified using
--log_dirargument. By default, log files are created in/tmp/. - Some flags might be missing either because they make no sense (e.g.,
--tui) or because I forgot to add them. In the latter case feel free to open an issue.
User interface
The interface consists of 4 containers between which the user can switch with vim-like controls:
To enter selection mode, press ESC (indicated by orange separators).
You can then navigate between containers using arrow keys or hjkl.
Press Enter to enter insert-mode and interact with the selected container.
Alternatively press the shortcut key for the specific container to directly enter it (see below) from selection mode.
GDB console
Interact using the standard gdb interface. Enter by pressing i.
PageUp/PageDownscroll the output of the console.Ctrl-b/Ctrl-ejump to the beginning/end of the buffer.- Use arrow keys/Backspace/
Home/Endto move the cursor. - Characters are inserted at the cursor position.
- Use
Tab/Ctrl-n/Ctrl-pfor identifier and gdb command completion. - Use
Ctrl-rto initiate history search andCtrl-c/left/right to accept and continue editing.
Pager
View and browse source code or assembly around the current program location. Enter by pressing s.
- Scroll up/down using arrow keys or jk and jump using
Home/End. - Navigate the stack using
PageUp/PageDown. - Use
Spaceto toggle breakpoints at the current location in the pager. - Toggle between source, assembly, and side-by-side mode using
d(if available).
Expression table
View and watch the (structured) results of gdb expressions (everything you can put after p in the console).
Changes between steps are highlighted.
Enter by pressing e.
- Enter an expression in the left column
- Press
Enterto advance to the next row to enter another expression. - Navigate using arrow keys.
- Use
Spacein the right column to interact with the structure viewer. - Use
Tab/Ctrl-n/Ctrl-pfor identifier completion. - Use
Ctrl-fto cycle through original/hex/decimal/octal/binary format for integers. - Use
Ctrl-wto (try to) set an access watchpoint for the current expression.
Note: The viewer is somewhat broken for displaying structures with custom pretty-printers. A workaround would be to use variable objects, but that would not allow for evaluation of arbitrary expressions.
Terminal
The tty of the program to be debugged is automatically redirected to this virtual terminal.
Enter by pressing t, or press T for locked mode.
Locked mode can only be exited by pressing Esc twice in rapid succession.
All other input is directly sent to the virtual terminal.
However, for most application the regular insert mode is sufficient and can be left by a single press of Esc.
- Scroll up/down using
PageUp/PageDown. Home/Enddirectly jump to the beginning/end of the output.
The virtual terminal does not yet properly implement all ansi functions, but it quite usable for a number of terminal applications.
IPC Interface
ugdb can be controlled remotely via a unix domain socket-based IPC interface.
The interface is documented here.
In practice this means that you can install vim-ugdb and set breakpoints in ugdb from vim using the UGDBBreakpoint command.
Builtin commands
These commands all start with a leading ! and can be entered instead of regular gdb commands into the gdb console.
!reload
Read the current executable from disk. You should run this, for example, when you have recompiled the binary that you are debugging and want to reuse an existing ugdb session.
!show <file>
Show the specified file in the pager. This may be useful if you interactively want to set breakpoints, but can't or don't want to use the IPC call from your editor (see vim-ugdb).
!layout <layout_string>
Change ugdb's tui layout at runtime.
The layout string represents a tree with single letters as leafs representing the different panes of ugdb (c for the GDB console, s for the pager, e for the expression table, and t for the terminal).
Nodes can be arranged in horizontal (e.g., c|s|e) or vertical (e.g., c-s-e) layouts using the separators | and -.
Brackets can be used to nest horizontal and vertical layouts (e.g., (c|s)-e).
Finally, integers preceding a node optionally define a weight (other than the default weight of 1) that will be used when assigning screen space to the node.
For example, 1c|3s will create arrange the console and pager horizontally while assigning roughly 25% of the space to the console and 75% to the pager.
The default layout of ugdb is (1s-1c)|(1e-1t).
An initial layout can also be specified using the command line parameter --layout.
FAQ
I get the error message "Cannot something because gdb is busy"
Because we communicate with gdb in synchronous mode, some tasks that require cooperation of gdb (such as setting breakpoints and disassembling source files) cannot be done when gdb is busy, i.e., when the currently debugged program is running. In this case you have to interrupt execution by pressing Ctrl-C in the console first. It may be possible to lift this limitation in the future using the non-stop-mode, but there are no immediate plans for implementation.
Some notes on the status
This project mostly scratches my own itch -- successfully. I use it as my primary debugger. In that sense I consider this project as "done", but additional sub-itches may be sub-scratched in the future.
Licensing
ugdb is released under the MIT license.
Dependencies
~19–29MB
~435K SLoC