13 releases
| 0.3.1 | Mar 5, 2024 |
|---|---|
| 0.3.0 | Jan 13, 2023 |
| 0.2.1 | Jan 5, 2023 |
| 0.1.8 | Jan 1, 2023 |
| 0.1.7 | Dec 29, 2022 |
#203 in Debugging
131 downloads per month
135KB
797 lines
Traceon - trace on
An easy to use log and tracing formatter with a flattened json or pretty output.
It builds on and simplifies the tracing crate, which adds context to log messages for better observability especially in async or multithreaded contexts, it focuses on logging all the associated context in flattened json or pretty print for every event, and is not concerned with span timings which can be done in a separate layer such as opentelemetry if required
the detailed tracing docs are here.
You can write your first trace with:
traceon::on();
traceon::info!("a simple message");
12:12:37 INFO a simple message
To capture the arguments used in a function:
#[traceon::instrument]
fn add(a: i32, b: i32) {
    traceon::info!("result = {}", a + b);
}

fn main() {
    traceon::on();
    add(5, 10);
}
Output:
09:52:33 INFO result = 15
    a:    5
    b:    10
    span: add
To use json output instead:
traceon::json();
Outputs one line of flattened json per event, this example is prettified:
{
  "time": "2023-01-01T05:28:13.447Z",
  "level": "INFO",
  "message": "result: 15",
  "a": 5,
  "b": 10,
  "span": "add"
}
It's configurable through the builder if you want to change any of the defaults
use traceon::{Case, JoinFields, LevelFormat, SecondsFormat, SpanFormat, TimeFormat, TimeZone, info};
fn main() {
    traceon::builder()
        // Add field with source code filename and line number e.g. src/main.rs:10
        .file()
        // Add field with target and module path e.g. mybinary::mymodule::submodule
        .module()
        // Turn off field with joined span name where the event occured e.g. parentspan::childspan
        .span(SpanFormat::None)
        // If the time is recorded in local system timezone or UTC
        .timezone(TimeZone::UTC)
        // Change the formatting of the time to RFC3339 with Seconds and Zulu
        .time(TimeFormat::RFC3339Options(SecondsFormat::Secs, true))
        // Change the casing of all the key names e.g. `camelCase` to `snake_case`
        .case(Case::Snake)
        // The characters used to concatenate field values that repeat in nested spans. Defaults to overwrite.
        .join_fields(JoinFields::All("::"))
        // Turn on json formatting instead of pretty output
        .json()
        // Change level value formatting to numbers for easier filtering
        // trace: 10
        // debug: 20
        // info:  30
        // warn:  40
        // error: 50
        .level(LevelFormat::Number)
        // Put anything that implements `Write` here to redirect output
        .writer(std::io::stderr())
        // on() activates it globally on all threads and panic if a global subcriber is already set
        // try_on() will return an error if a global subscriber is already set
        // on_thread() will return a guard so the subscriber will only be active in the current scope and thread
        .on();

    info!("a simple message");
}
Output
{
    "timestamp": "2023-01-01T03:26:48Z",
    "level": 30,
    "module": "builder",
    "file": "examples/builder.rs:27",
    "message": "a simple message"
}
env-filter is used by default at the info level to filter any messages out at the debug or trace level, to change the level you can set an environment variable e.g. RUST_LOG=warn which would filter out info level as well, or RUST_LOG=trace to show all events. There are many options detailed here
Examples
#[instrument] macro
You can use the traceon::instrument macro with both async and normal functions to capture the arguments used in each function call:
use traceon::{instrument, info};

#[instrument]
async fn add(a: i32, b: i32) {
    info!("result: {}", a + b);
}

#[tokio::main]
async fn main() {
    traceon::builder().on();
    add(5, 10).await;
}
06:16:30 INFO result: 15
    a:    5
    b:    10
    span: add
Instrument trait
If you need to add additional context to an async function, you can create a span and instrument it:
use tracing::{Instrument, info};

async fn add(a: i32, b: i32) {
    tracing::info!("result: {}", a + b);
}

#[tokio::main]
async fn main() {
    traceon::builder().on();
    let span = tracing::info_span!("math_functions", package_name = env!("CARGO_PKG_NAME",));
    add(5, 10).instrument(span).await;
}
06:18:55 INFO result: 15
    package_name: traceon
    span:         math_functions
The above package_name comes from Cargo.toml at compile time and is saved to the binary for runtime:
[package]
name = "traceon"
Entered spans
This creates a span and returns a guard, as long as that guard is in scope the span will be active:
fn add(a: i32, b: i32) {
    tracing::info!("result: {}", a + b);
}

fn main() {
    traceon::builder().on();
    let _guard = tracing::info_span!("math", package_name = env!("CARGO_PKG_NAME")).entered();
    add(5, 10);
}
06:26:21 INFO result: 15
    package_name: traceon
    span:         math
Warning If
add()was anasync fn, holding onto the guard would cause memory leaks and information loss, you must use the aboveinstrumentmacro or trait instead, more details here
Note Just remember don't call
.awaitwhile holding onto a guard
Nested spans
By default the span name will be joined with the characters :: for nested spans:
use traceon::{instrument, info};

#[instrument]
fn add(a: i32, b: i32) {
    tracing::info!("result: {}", a + b);
}

fn main() {
    traceon::builder().on();
    let _guard = tracing::info_span!("math", package_name = env!("CARGO_PKG_NAME")).entered();
    add(5, 10);
}
06:33:57 INFO result: 15
    a:            5
    b:            10
    package_name: traceon
    span:         math::add
You can set this to overwrite if you prefer:
use traceon::SpanFormat;
traceon::builder().span(SpanFormat::Overwrite).on();
06:36:00 INFO result: 15
    a:            5
    b:            10
    package_name: traceon
    span:         add
By default all the other fields overwrite if a nested span has the same field name, you can join all fields or specific fields if you prefer (this only effects text values):
use traceon::{JoinFields, info, info_span};
traceon::builder()
    .join_fields(JoinFields::Some("||", &["field_b"]))
    .on();

let _span_1 = info_span!("span_1", field_a = "original", field_b = "original").entered();
let _span_2 = info_span!("span_2", field_a = "changed", field_b = "changed").entered();

info!("testing field join");
output:
12:44:12 INFO testing field join
    field_a: changed
    field_b: original||changed
    span:    span_1::span_1
Change the case of keys
Often you'll be consuming different crates that implement their own traces and you need all their keys to match a certain format, this example also demonstrates how to use different instances of traceon for a given scope with on_thread(), which returns a guard so the subscriber is only running on the current thread, and will be turned off when the guard is dropped.
use traceon::{Case, Level, event};

fn main() {
    let _guard = traceon::builder().case(Case::Pascal).on_thread();
    event!(
        Level::INFO,
        message = "PascalCase",
        PascalCase = "test",
        camelCase = "test",
        snake_case = "test",
        SCREAMING_SNAKE_CASE = "test",
    );

    let _guard = traceon::builder().case(Case::Camel).on_thread();
    event!(
        Level::INFO,
        message = "camelCase",
        PascalCase = "test",
        camelCase = "test",
        snake_case = "test",
        SCREAMING_SNAKE_CASE = "test",
    );

    let _guard = traceon::builder().case(Case::Snake).on_thread();
    event!(
        Level::INFO,
        message = "snake_case",
        PascalCase = "test",
        camelCase = "test",
        snake_case = "test",
        SCREAMING_SNAKE_CASE = "test",
    );
}
Output:
10:06:38 INFO PascalCase
    CamelCase:          test
    PascalCase:         test
    ScreamingSnakeCase: test
    SnakeCase:          test

10:06:38 INFO camelCase
    camelCase:          test
    pascalCase:         test
    screamingSnakeCase: test
    snakeCase:          test

10:06:38 INFO snake_case
    camel_case:           test
    pascal_case:          test
    screaming_snake_case: test
    snake_case:           test
Event
tracing::event! allows you to add fields to message without having to create a span, just remember to put the level e.g. tracing::Level::INFO as the first parameter, this also shows how to create a custom message in an event, and how to output a Debug implementation:
use tracing::{Level, event};

fn main() {
    traceon::builder().on();

    event!(
        Level::INFO,
        event_example = "add field and log it without a span"
    );

    let vector = vec![10, 15, 20];
    event!(
        Level::WARN,
        message = "overwrite message, and debug a vector",
        ?vector,
    );
}
06:47:00 INFO event triggered
    event_example: add field and log it without a span

06:47:00 WARN overwrite message, and debug a vector
    vector: [10, 15, 20]
Write to a file
If you wanted to write to log files instead of std, it's as simple adding the dependency to Cargo.toml:
[dependencies]
tracing-appender = "0.2.2"
And initializing it via the builder:
use traceon::info;

let file_appender = tracing_appender::rolling::hourly("./", "test.log");
traceon::builder().json().writer(file_appender).on();
info!("wow cool!");
The writer accepts anything that implements the Write trait, if you want to hold onto a buffer wrapped in an Arc and Mutex there is buffer() method on the builder.
Compose with other layers
You can also use the formatting layer with other tracing layers as you get more comfortable with the tracing ecosystem, for example to add opentelemetry:
use opentelemetry::trace::TracerProvider as _;
use opentelemetry_sdk::trace::TracerProvider;
use opentelemetry_stdout as stdout;
use tracing::{info, span};
use tracing_subscriber::layer::SubscriberExt;
use tracing_subscriber::Registry;

fn main() {
    let provider = TracerProvider::builder()
        .with_simple_exporter(stdout::SpanExporter::default())
        .build();

    let tracer = provider.tracer("readme_example");
    let telemetry = tracing_opentelemetry::layer().with_tracer(tracer);
    // Compose opentelemetry with traceon
    let subscriber = Registry::default().with(telemetry).with(traceon::builder());

    tracing::subscriber::with_default(subscriber, || {
        let root = span!(tracing::Level::TRACE, "app_start", work_units = 2);
        let _enter = root.enter();

        info!(
            "This will log the full span data to stdout via opentelemetry \
            along with the simplified and flattened data using traceon"
        );
    });
}
Performance
This crate uses the idea originated from: LukeMathWalker/tracing-bunyan-formatter of storing fields from visited spans in a HashMap instead of a BTreeMap which is more suited for flattening fields, and results in very similar performance to the json formatter in tracing-subscriber:
logging to a sink
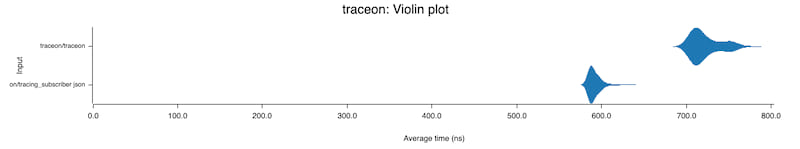
units = nanosecond or billionth of a second
logging to stdout
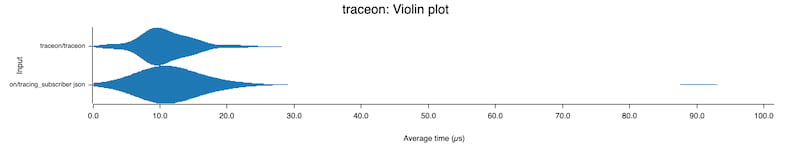
units = microsecond or millionth of a second
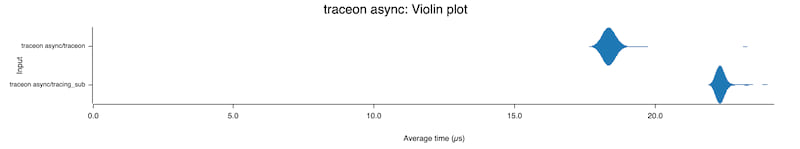
Nested spans three levels deep with concatenated fields
Dependencies
~7–16MB
~187K SLoC